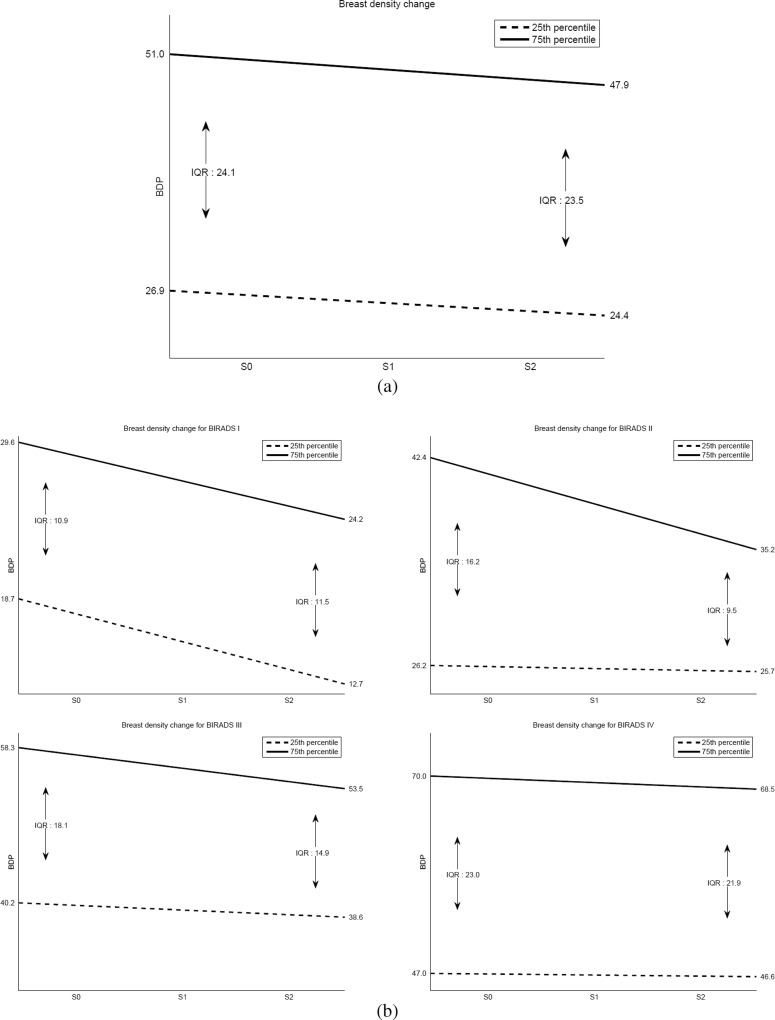
Fig. 5.
First (dotted line) and third (continuous line) quartile evolution of breast density percentage when using a the entire database or b split according to the BI-RADS categories (from left top to bottom right: BI-RADS I, BI-RADS II, BI-RADS III and BI-RADS IV). S0 contains the initial follow-up exams, S1 contains the second follow-up and S2 contains the third follow-up. Note the differences between the density categories

