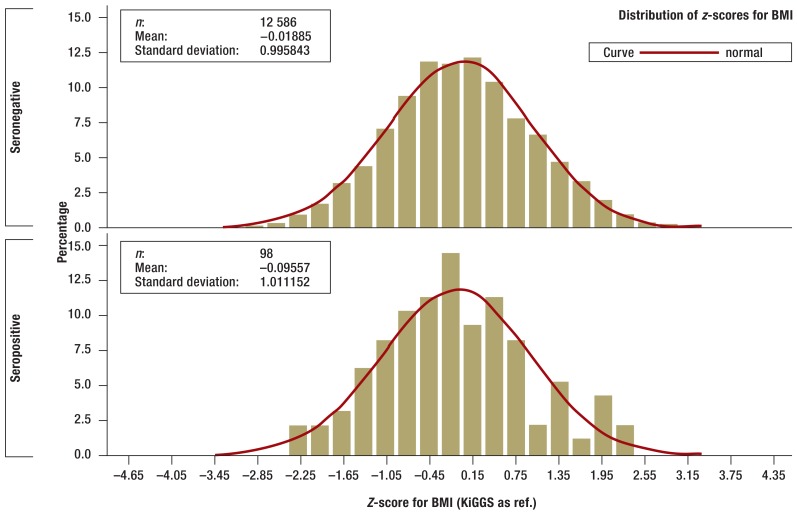
Figure 2b.
Z-scores for body mass index (BMI) of seronegative (above) and seropositive (below) children and adolescents in the KiGGS study (histogram). Z-scores are standardized for age and sex and adjusted to the range of values of standard normal distribution. Z-scores were calculated using the KiGGS study percentiles (30).

