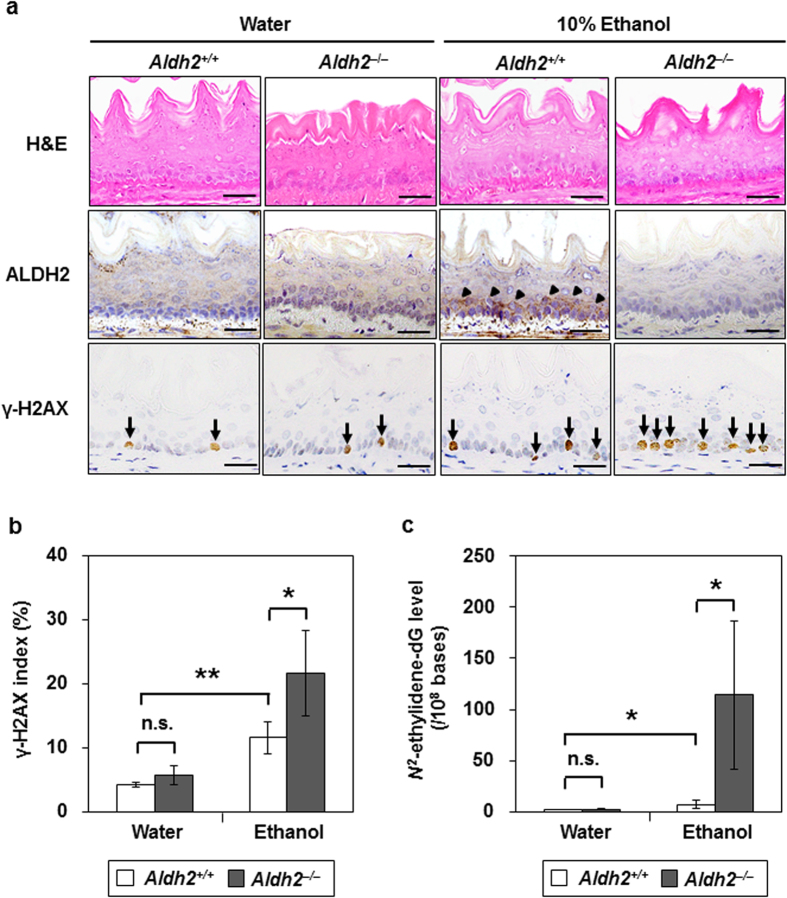
Figure 1. Effects of ethanol drinking in Aldh2+/+ and Aldh2–/– mice oesophagus.
The mice were allowed to drink 10% ethanol or water alone (controls) for 8 weeks. Data are presented as the mean ± SD. (a) Hematoxylin and eosin (H&E) and immunohistochemical staining for ALDH2 (arrowheads) and γ-H2AX (arrows). Scale bar = 50 μm. (b) The index of γ-H2AX staining is defined as the proportion of cells staining positive for γ-H2AX in the oesophageal basal cell layer (**p < 0.01, *p < 0.05 between the indicated groups; n = 5 in each group; n.s., not significant). (c) N2-ethylidene-dG level in the oesophagus of Aldh2+/+ and Aldh2–/– mice with or without ethanol consumption (*p < 0.05 between the indicated groups; n = 5 in each group).

