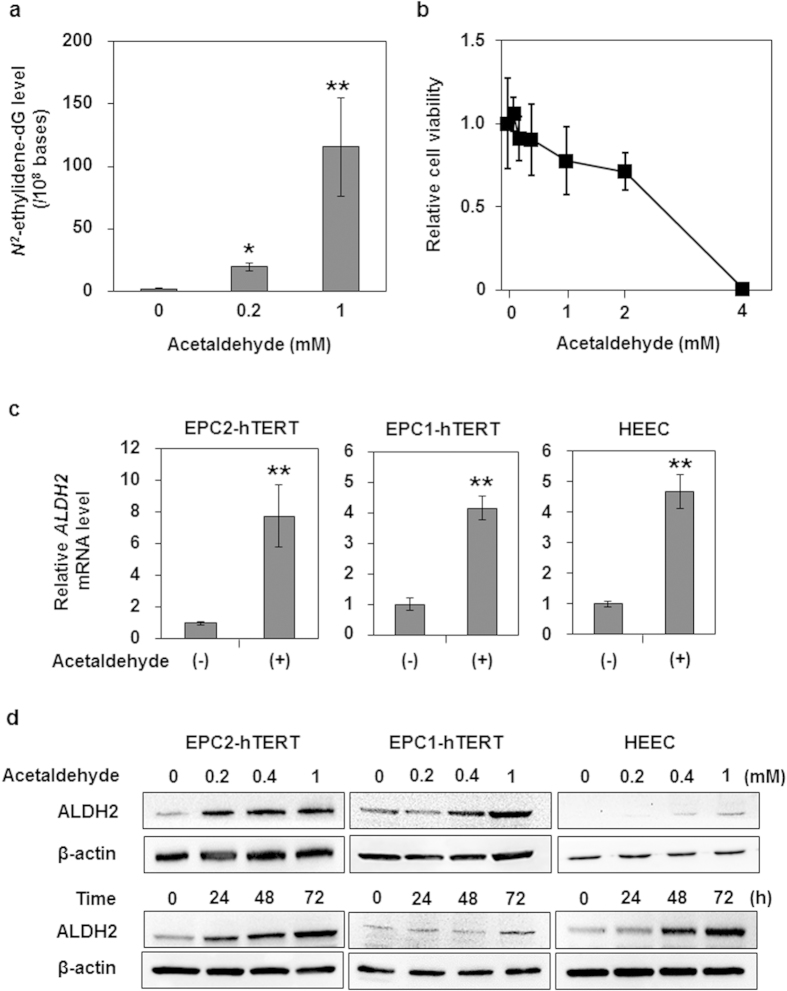
Figure 2. Effects of acetaldehyde treatment on human oesophageal keratinocytes.
Data are presented as the mean ± SD. (a) N2-ethylidene-dG levels in DNA isolated from EPC2-hTERT cells treated with the indicated concentrations of acetaldehyde for 72 h (**p < 0.01, *p < 0.05 vs. the cells treated with 0 mM acetaldehyde; n = 3). (b) Cell viability of EPC2-hTERT cells treated with various concentrations of acetaldehyde for 72 h. The ratio of viable cells is expressed relative to the cells treated with 0 mM acetaldehyde (n = 6 for each acetaldehyde concentration). (c) ALDH2 mRNA expression levels in EPC2-hTERT, EPC1-hTERT, and HEEC cells after treatment with acetaldehyde (1 mM) for 72 h. The mRNA levels for the ALDH2 gene relative to the cells treated with 0 mM acetaldehyde were determined by quantitative real-time reverse transcription PCR; the gene for β-actin served as an internal control (**p < 0.01 vs. the cells treated with 0 mM acetaldehyde; n = 3). (d) ALDH2 protein production levels in EPC2-hTERT, EPC1-hTERT, and HEEC cells after treatment with the indicated concentrations of acetaldehyde for 72 h (upper panels) or with acetaldehyde (0.2 mM) for the indicated time points (lower panels). ALDH2 protein production levels were determined by western blotting, and β-actin served as a loading control.

