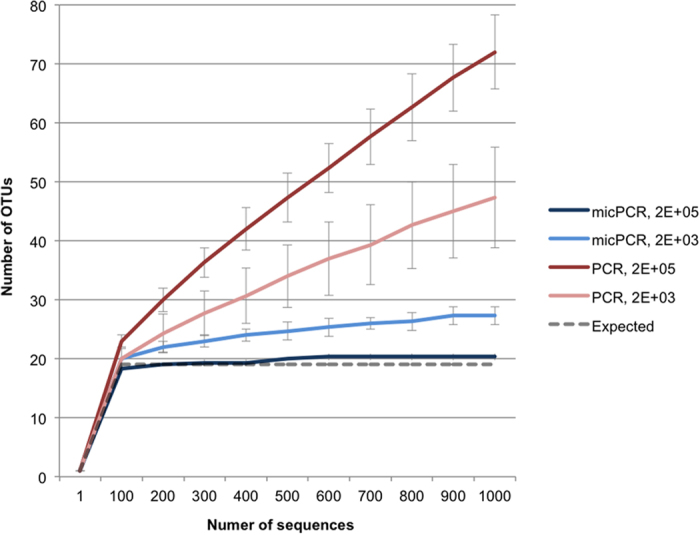
Figure 1. Comparison of rarefaction analyses between micPCR/NGS and traditional PCR/NGS using an equimolar, synthetic microbial community.

The number of observed OTUs in the synthetic microbial community is shown as the function of the number of sequences obtained using micPCR/NGS reactions containing 2E + 05 (dark blue) and 2E + 03 (light blue) input molecules, and traditional PCR/NGS reactions containing 2E + 05 (dark red) and 2E + 03 input molecules (light red). Data points represent average values from triplicate experiments and error bars show standard deviations. Rarefaction curves were generated using mothur19 with an OTU defined at 97% similarity. Analysis was performed on a random 1,000-sequence subset from each sample. Staphylococcus aureus and Staphylococcus epidermidis present in the synthetic community could not be differentiated at a 97% similarity level, resulting in a maximum of 19 expected OTUs.
