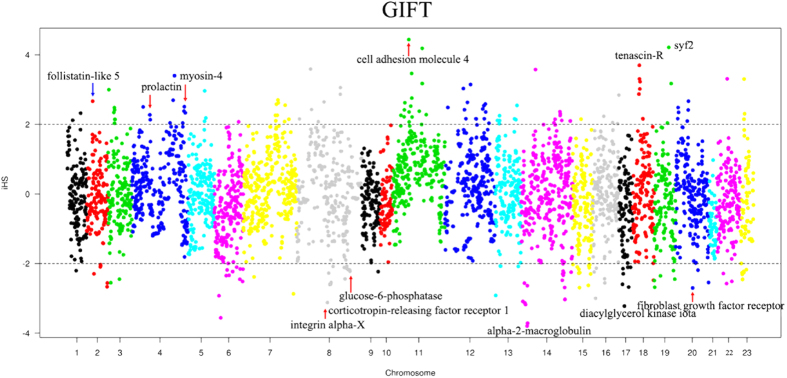
Figure 5. The genome-wide sweep analysis based on iHS statistics for the GIFT tilapia population.

The iHS value at a locus on each chromosome are shown in the figure. Some genes with significant SNPs when using an iHS threshold of ±2 are shown. The LG8_24, LG16_21 and Unk1 scaffold are shown as Chromosome 8, 16 and 21 for clarity.
