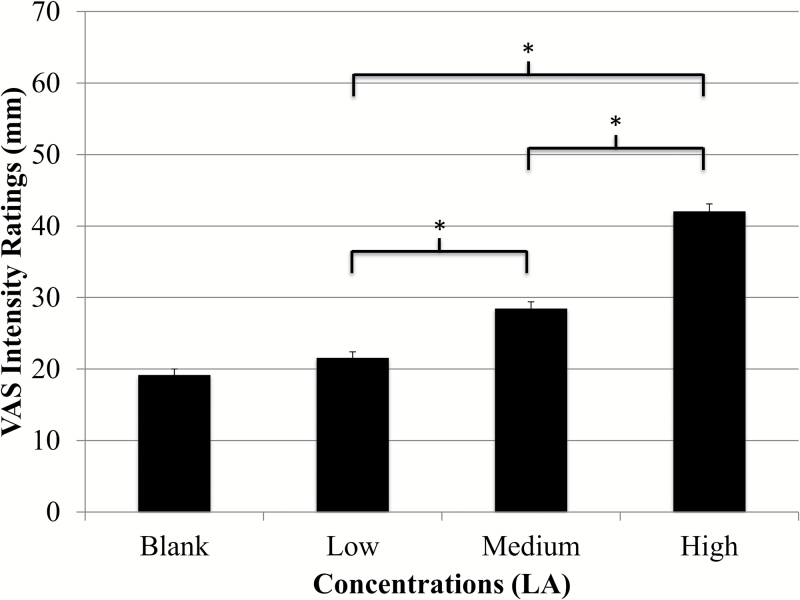
Figure 2.
Whole group intensity ratings of LA (N = 735). There were significant differences (P < 0.001) for intensity ratings of low (21.5±0.9mm), medium (28.4±1.0), and high concentrations (42.0±1.1) of fat taste stimuli as recorded on a VAS scale. Ratings increased in a dose-dependent fashion (mean ± SEM).

