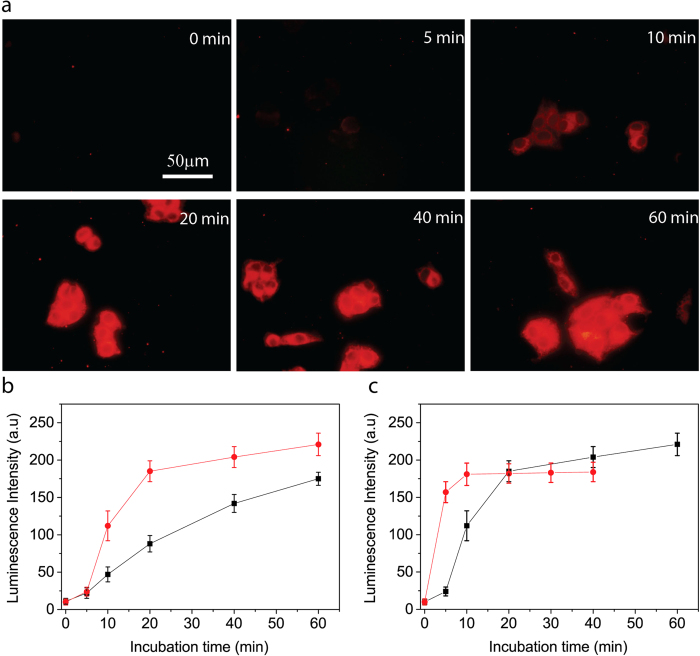
Figure 4. Time-gated luminescence imaging and real-time quantifications of the extracellular vitamin C uptake and intracellular production of vitamin C in living cells.
(a) Time-gated luminescence microscopy images of HepG2 cells loaded with 1.0 mM vitamin C at different loading times and followed by incubation with 20 μM TOB-Eu3+ for 1 h. Scale bar: 50 μm. (b) Time-gated luminescence intensities of HepG2 (•) and HeLa (■) cells loaded with 1.0 mM vitamin C for various incubation times and followed by incubation with 20 μM TOB-Eu3+ for 1 h. (c) Time-gated luminescence intensity of HepG2 cells loaded with 1.0 mM AA (■) or 1.0 mM DHA (•) for various incubation times and followed by incubation with 20 μM TOB-Eu3+.

