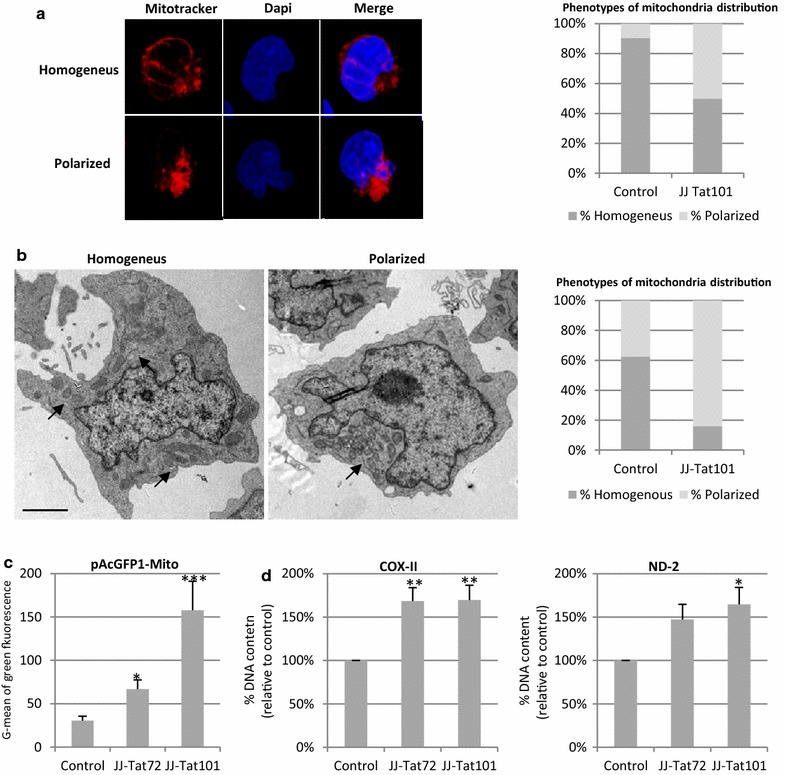
Fig. 8.

Effect of intracellular Tat expression on mitochondrial mass and its subcellular distribution. a Mitochondria distribution within Jurkat-101 vs control cells was analyzed by microscopy after staining with Mitotracker probe. The nucleus was stained with DAPI. Representative images of a cell with homogeneous and polarized mitochondrial mass distribution are shown. The graph includes the percentage of each phenotype in Jurkat-Tat101 and control cells. b Mitochondria network distribution was also analyzed by electron microscopy using ultrathin sections. Representative images from control and Jurkat-Tat101 cells showing the homogeneous and polarized mitochondrial network distribution are shown. Scale bar corresponds to 200 nm. The graph shows the percentage of each phenotype in Jurkat-Tat101 and control cells. c Expression of the nuclear-encoded VIII sunit of the cytochrome c oxidase was analyzed by flow cytometry in Jurkat-Tat72, Jurkat-Tat101 and control cells transfected with a vector coding for this protein bound to GFP (pAcGFP1-Mito). Graph shows G-mean of green fluorescence intensity of the living cell population from three independent experiments. Statistical significance was calculated with Kruskal–Wallis test with Dunn’s multiple comparison test (*p < 0.05 and ***p < 0.001). d qPCR measurement of mitochondria DNA matching with regions coding for COX-II and MTND-2 genes. Nuclear-encoded DNA S18 was used as house-keeping gene. Data shown are media and SEM from three independent experiments. Statistical significance was calculated with Kruskal–Wallis test with Dunn’s multiple comparison test (*p < 0.05 and **p < 0.01)
