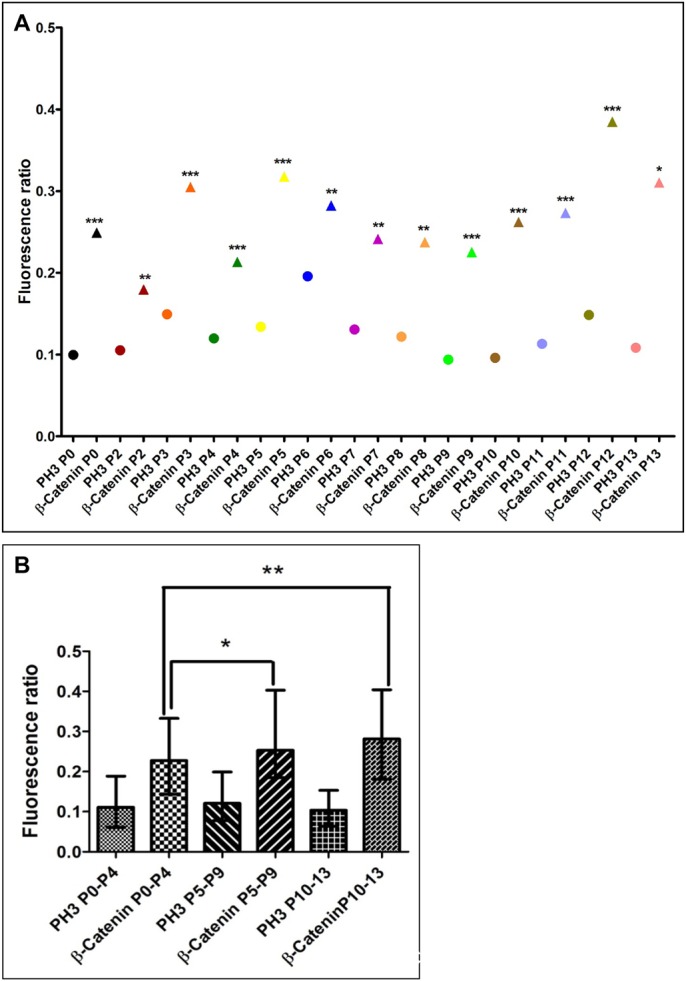
Fig. 4.

Fluorescence intensity ratios of β-Catenin in anaphase cells of the cerebellar EGL. (A) The graph shows the median fluorescence ratio obtained for PH3 (circle) and β-Catenin (triangle) for all the cell pairs at each age. P values between relative fluorescence ratio for PH3 versus β-Catenin was determined by Wilcoxon matched pair one tailed test for every cell at each age (***p<0.001, **p <0.01,*p<0.05). (B) Age grouped median fluorescence ratio with error bars representing interquartile range. The relative fluorescence ratio for β-Catenin increases significantly between P0–P4 and P5–P9 and between P0–P4 and P10–P13 (*p<0.05, **p<0.01, Mann-Whitney U test).
