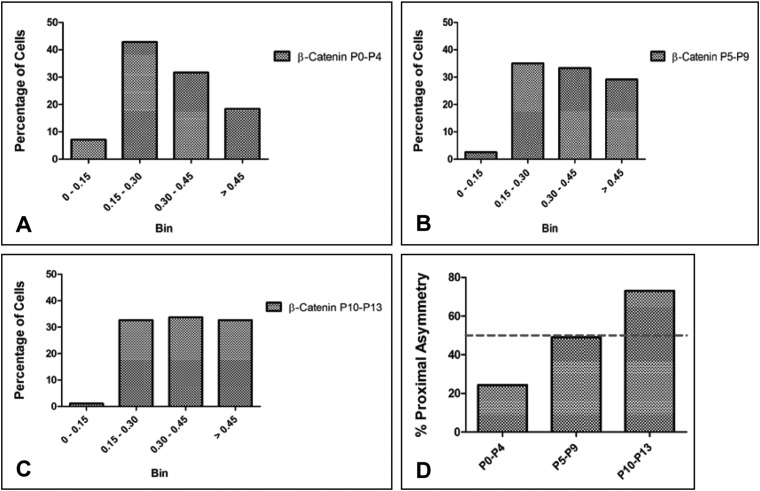
Fig. 5.
β-Catenin asymmetry during cerebellar development. Percentage of cells having different amounts of asymmetry: 0–0.15 (symmetric distribution), 0.15–0.30 (weak asymmetry), 0.30–0.45 (asymmetric) and >0.45 (strongly asymmetric) plotted for (A) P0–P4, (B) P5–P9 and (C) P10–P13 respectively. (D) Percentage of asymmetric cells that show more β-Catenin in the cell proximal to the pial surface at P0–P4, P5–P9 and P10–P13. The dashed line in the graph is drawn at 50% which would be the percentage of obtaining proximal asymmetry if there was no bias.

