Fig. 1.

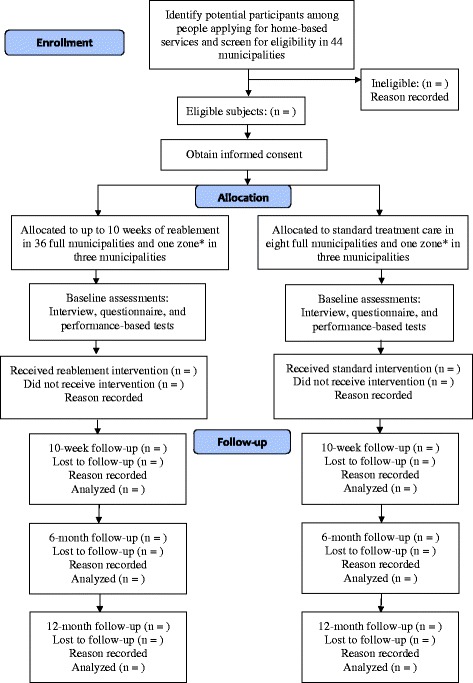
Flow diagram showing the study protocol. *Three municipalities are each divided into two zones, where one zone acts as a control group and the other as an intervention group

Flow diagram showing the study protocol. *Three municipalities are each divided into two zones, where one zone acts as a control group and the other as an intervention group