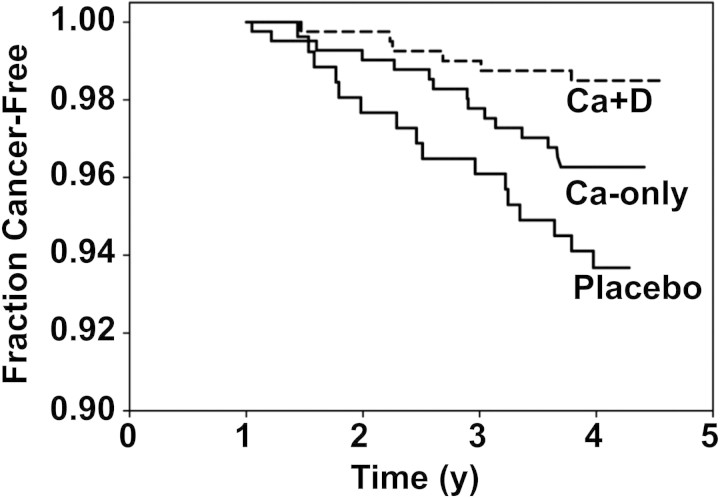
Figure 3.
Kaplan-Meier survival curves (i.e., free of cancer) for the three treatment groups randomly assigned in the cohort of women who were free of cancer at 1 yr of intervention (n = 1085). Sample sizes are 266 for the placebo group, 416 for the calcium-only (Ca-only) group, and 403 for the calcium plus vitamin D (Ca+D) group. The survival at the end of study for the Ca+D group is significantly higher than that for the placebo group, by logistic regression. Reprinted with permission from Dr. Robert Heaney, 2007.

