
Fig. 3.
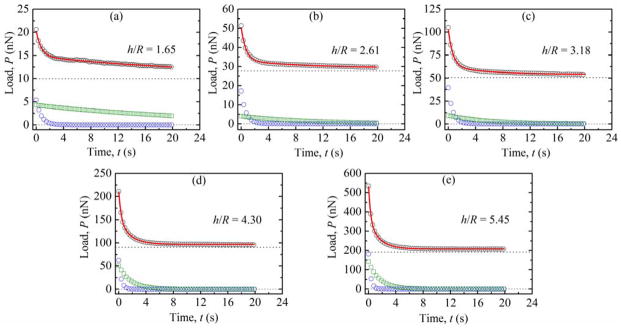
Representative load-relaxation (P-t) data for (a) 20 nN, (b) 50 nN, (c) 100nN, (d) 200 nN, and (e) 500 nN maximum applied loads, along with the h/R values, during the 20 s hold portion. The horizontal dotted line represents the fitted equilibrium load, B0, while the blue circles and green squares represent viscoelastic (B1) and poroelastic (B2) contributions to the load-relaxation, respectively. The full fitted transient mechanical response is shown as a solid red line.