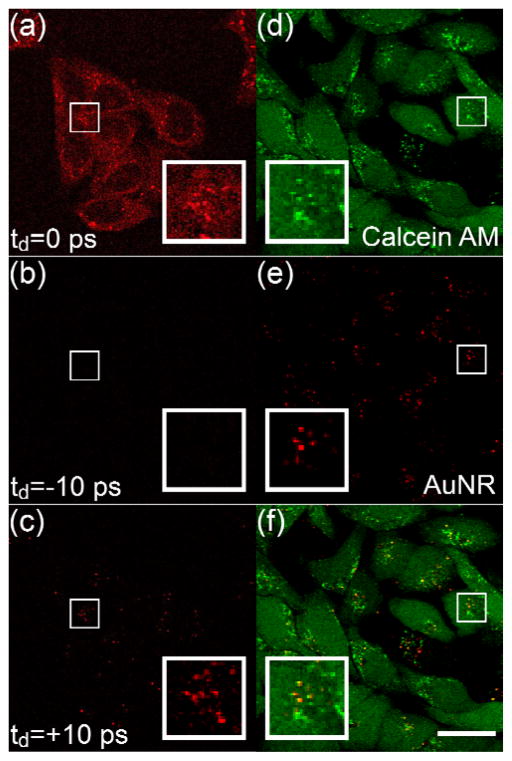
Fig. 3.
Imaging AuNRs in live cells. (a)–(c) Imaging AuNRs in live HeLa cells at different delay time between the pulse trains of pump and probe beams. Inset in (c) shows a magnified region with AuNRs. (d) Two-photo luminescence (TPL) image of AuNRs-containing live HeLa cells stained with calcein AM. (e) TA image of AuNRs demodulated by a lock-in amplifier. (f) Merged image of (d) and (e), showing the distribution of AuNRs in a highly fluorescent background. Inset in (f) shows a zoomed region, yellow indicates colocalized TPL and TA signal from AuNRs. Scale bar: 25 μm.

