
Fig. 2.
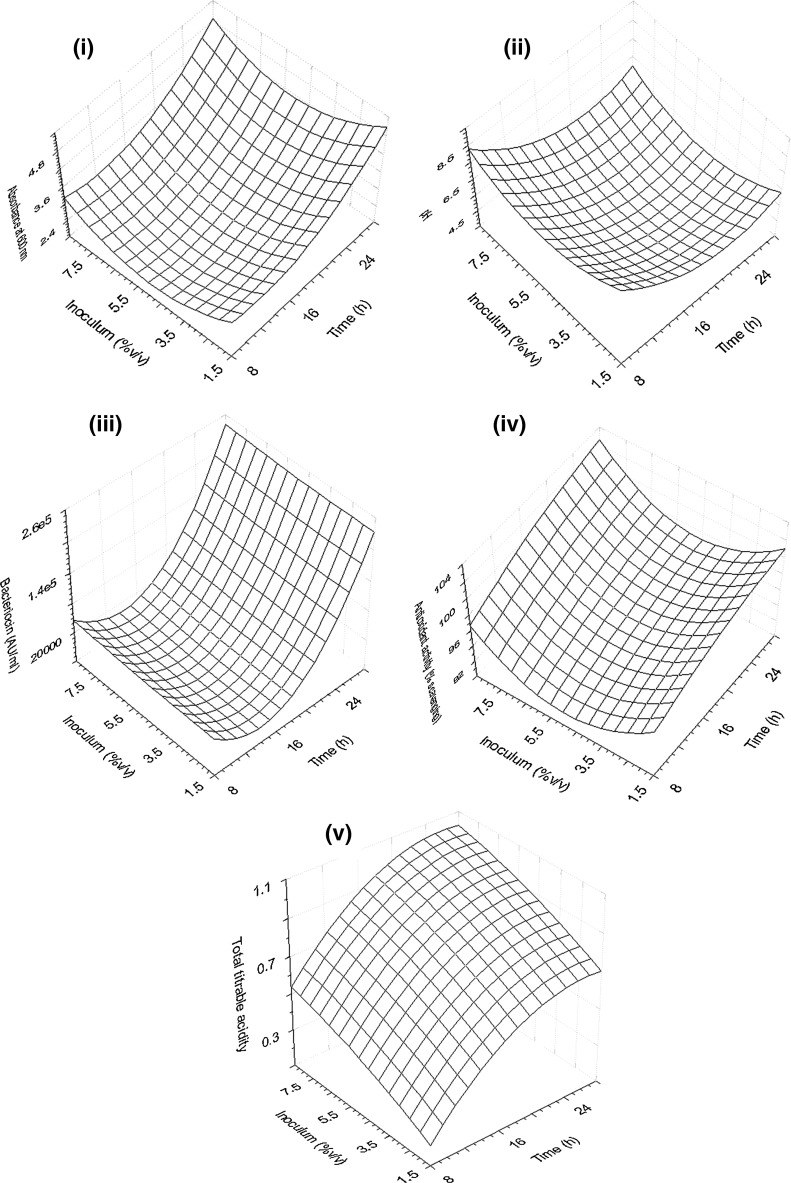
Response surface graphs showing the effect of incubation time (a) and inoculum level (b) on cell growth (i), pH (ii), bacteriocin production (iii), DPPH free radical scavenging activity (iv) and total titrable acidity (v)
Official websites use .gov
A
.gov website belongs to an official
government organization in the United States.
Secure .gov websites use HTTPS
A lock (
) or https:// means you've safely
connected to the .gov website. Share sensitive
information only on official, secure websites.
Response surface graphs showing the effect of incubation time (a) and inoculum level (b) on cell growth (i), pH (ii), bacteriocin production (iii), DPPH free radical scavenging activity (iv) and total titrable acidity (v)