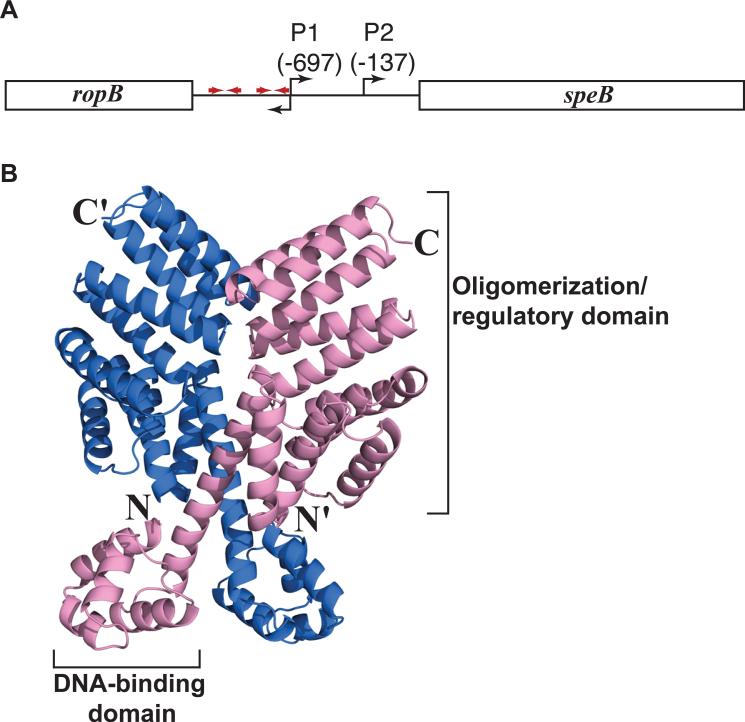
Figure 1. Organization of the speB gene region and RopB model.
(A) Organization of the speB gene region in strain MGAS10870. The divergently transcribed speB and ropB genes are shown as rectangle boxes and labeled. The bent arrows above the line indicate two transcription start sites of speB and bent arrow below denote the transcription start site of ropB. Red arrows indicate putative palindromic sites that have the RopB binding site. Data regarding transcription start sites and RopB binding sites are derived from (Neely et al., 2003). (B) RopB structure predicted by I-TASSER protein modeling server (http://zhanglab.ccmb.med.umich.edu/ITASSER). Ribbon representation of the predicted RopB homodimer is shown and the individual subunits of RopB dimer are colored in blue and pink. The amino- and carboxy-terminus of one subunit are indicated as N and C, respectively, and those of the second subunit are indicated with a prime ('). The putative DNA-binding domain in the amino-terminus and the oligomerization/regulatory domain in the carboxy-terminus of one subunit are labeled. The model shown is modified from Figure 2 from (Carroll et al., 2011).

