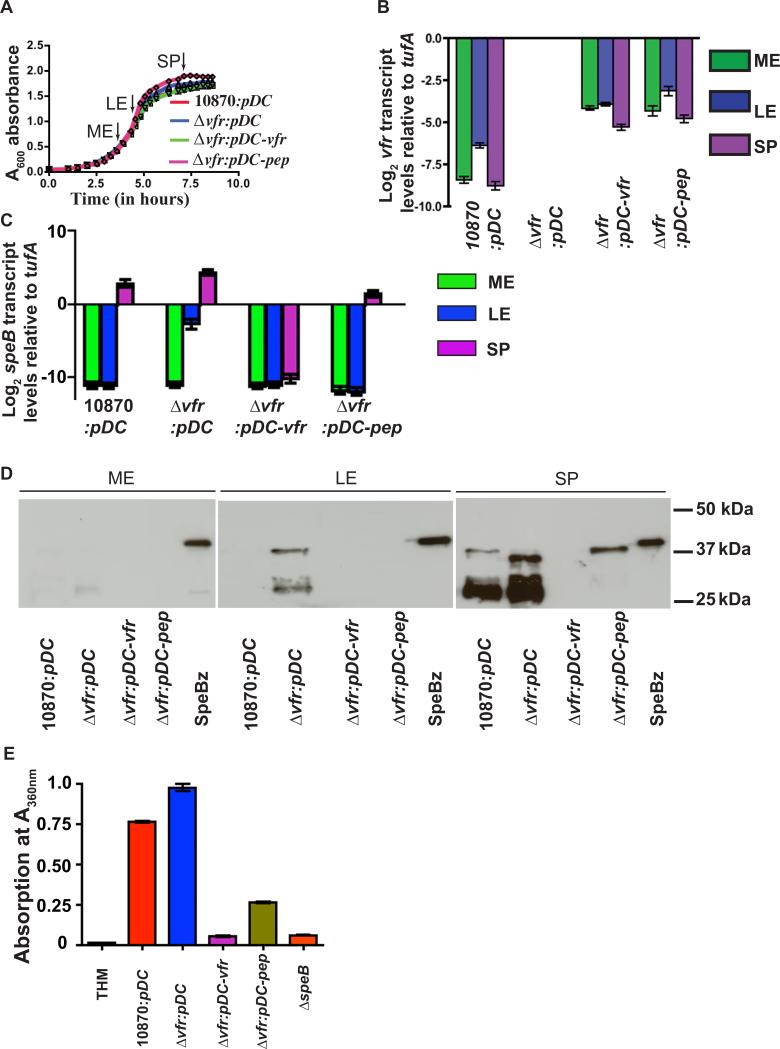
Figure 3. The secretion signal sequence of Vfr restores a wild-type speB expression profile to strain Δvfr.
(A) Growth pattern of indicated strains in THY broth. Samples were collected at mid-exponential (ME A600 ~ 0.6), late-exponential (LE A600 ~ 1.0) and stationary phase (SP A600 ~ 1.7) for transcript and protein analysis at time points designated by arrows. (B) vfr transcript levels as measured by Taqman qRT-PCR at indicated growth phase. (C) speB transcript levels in complemented strains at indicated growth phases. For (B) and (C), biological replicates were analyzed in duplicate on two separate occasions with data graphed being mean ± standard deviation. (D) Western immunoblot analysis of SpeB in filtered growth media prepared from indicated strains at indicated growth phases. (E) Assay of SpeB protease activity in the culture supernatant by azocasein hydrolysis. Azocasein hydrolysis by SpeB was assessed by absorption at A360 nm. Samples were analyzed in triplicates on two separate occasions with data graphed are mean ± standard deviation.

