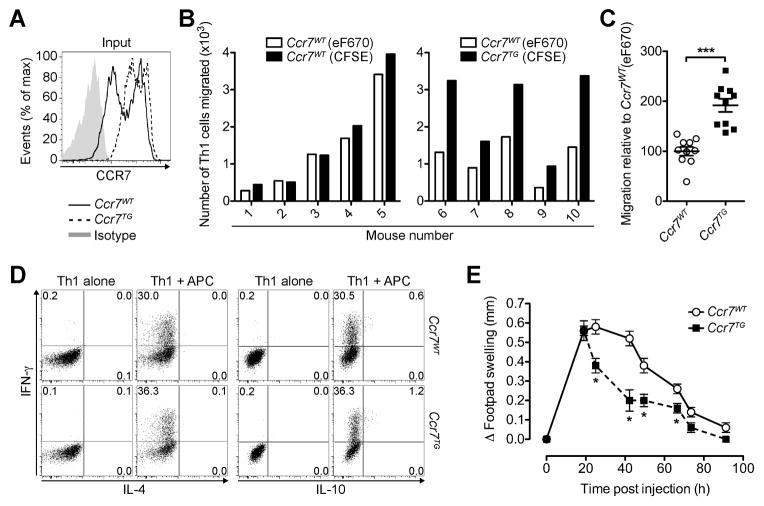
FIGURE 2. Transgenic expression of CCR7 enhances effector T cell egress from inflamed tissue and accelerates resolution of inflammation.
(A–C) CFSE-labeled Ccr7WT or Ccr7TG OTII Th1 cells were mixed with eF670-labeled Ccr7WT OTII Th1 cells and incubated with OVA-pulsed APCs, before injection into the footpads of WT recipients. 20 h later, dLN were analyzed for donor cells. (A) Representative CCR7 staining of Th1 cells prior to injection. (B) Quantification of donor Th1 cells that migrated to the dLN. (C) Tissue egress of CFSE-labeled Ccr7WT and Ccr7TG OTII Th1 cells relative to eF670-labeled Ccr7WT OTII Th1 cells. Data are expressed as a percentage of the mean ratio of CFSE+ to eF670+ Ccr7WT Th1 cells that migrated to the dLN (set as 100%) combined from 2 experiments. (D) Intracellular cytokine profile of in vitro generated Ccr7WT OTII and Ccr7TG OTII Th1 cells prior to injection with and without stimulation with OVA-pulsed APCs. (E) Ccr7WT OTII or Ccr7TG OTII Th1 cells were co-incubated with OVA-pulsed APCs, injected into the footpads of separate groups of mice and inflammation was measured over time. Data points depict individual recipients (B and C) and/or the mean ± SEM of each group (C and E). One experiment of ≥ 2 with similar results (A, B, D, E) or the combined analysis of all (N=2) experiments (C) using 5 mice per group is shown. *P < 0.05; ***P < 0.005.

