
Figure 3.
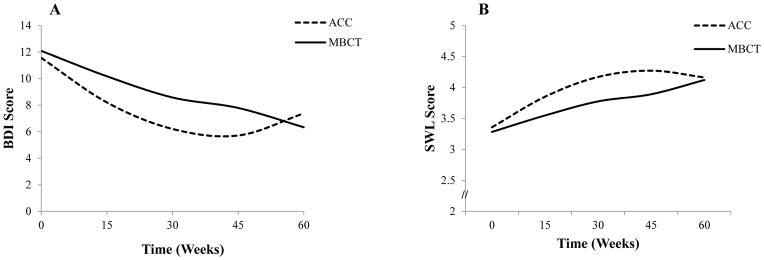
Differential pattern of quadratic change in depressive symptoms (BDI-Panel A) and life satisfaction (SWL-Panel B) between groups. Zero weeks=baseline. BDI-II scale range: 0–63; SWL scale range: 1–7.
Official websites use .gov
A
.gov website belongs to an official
government organization in the United States.
Secure .gov websites use HTTPS
A lock (
) or https:// means you've safely
connected to the .gov website. Share sensitive
information only on official, secure websites.
Differential pattern of quadratic change in depressive symptoms (BDI-Panel A) and life satisfaction (SWL-Panel B) between groups. Zero weeks=baseline. BDI-II scale range: 0–63; SWL scale range: 1–7.