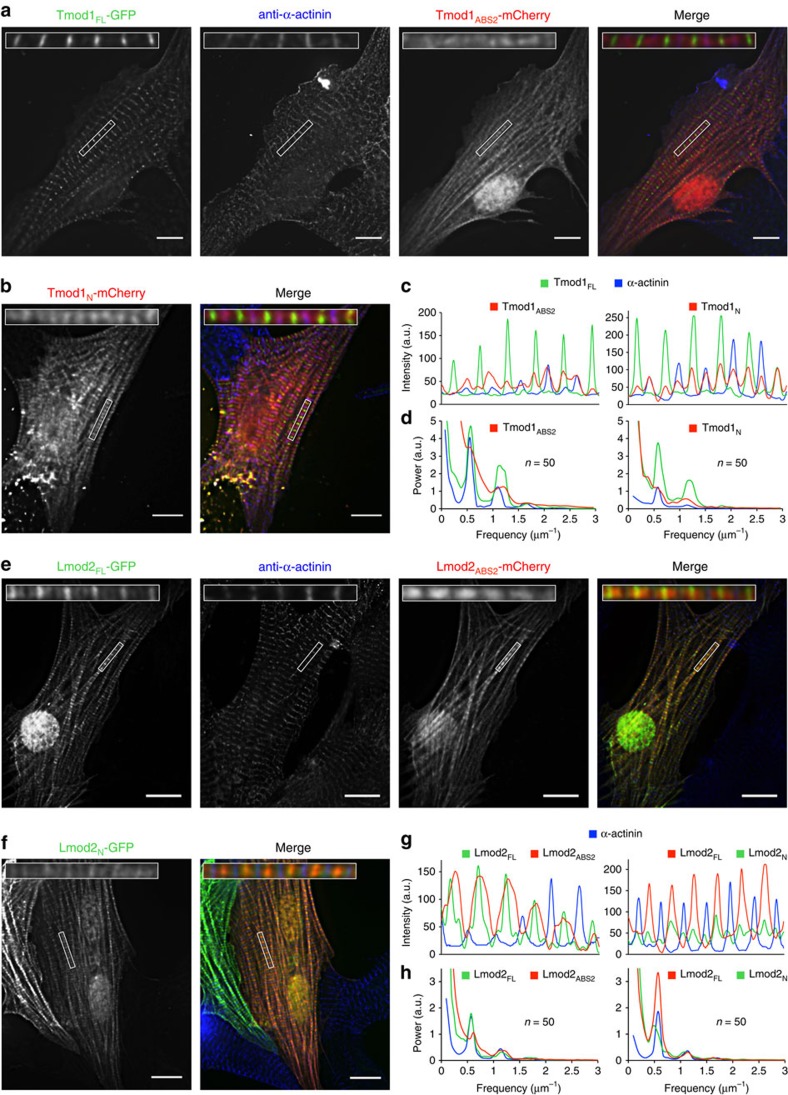
Figure 5. Localization of Tmod1 and Lmod2 constructs in sarcomeres.
(a,b) Cardiomyocytes co-transfected on day 1 with Tmod1FL-GFP and Tmod1ABS2-mCherry (or Tmod1N-mCherry), fixed 24 h after transfection, and stained with anti-α-actinin antibodies (Z-line marker). Note that Tmod1FL-GFP and α-actinin are shown separately only in part (a) but these markers are also present in part. (b). (c) Line-scans of each marker (colour coded) along a representative myofibril (insets in parts a,b). (d) Average power spectra resulting from one-dimensional (1D) fast Fourier transform (FFT) analysis of 50 line-scans from six cells transfected with Tmod1ABS2 (or Tmod1N). The frequency of the power peak for Tmod1FL and α-actinin is 0.572 μm−1, corresponding to a distance of 1.75 μm between M lines or Z lines, respectively. In contrast, there is no defined power peak in the spectra of Tmod1ABS2 or Tmod1N, reflecting a loss of periodicity in their localization. (e,f) Cardiomyocytes co-transfected with Lmod2FL-GFP and Lmod2ABS2-mCherry (or Lmod2FL-mCherry and Lmod2N-GFP) and stained with anti-α-actinin antibodies. (g) Line-scans of each marker (colour coded) along a representative myofibril (insets in parts e,f). (h) Average power spectra resulting from 1D FFT analysis of 50 line-scans from six cells transfected with Lmod2ABS2 (or Lmod2N). All the spectra show similar periodicity, with power peaks at 0.59 and 0.55 μm−1 for Lmod2ABS2 and Lmod2N, respectively. The Tmod1 and Lmod2 constructs are defined in Methods and in Fig. 1a. Scale bars, 10 μm.

