
FIGURE 2.
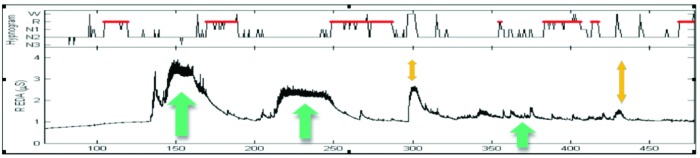
Skin conductance analysis of sleep peaks. The green arrows indicate regions with high-frequency peaks abutting transitions to REM. The yellow arrows indicate regions with high frequency peaks interrupted by wake.
Official websites use .gov
A
.gov website belongs to an official
government organization in the United States.
Secure .gov websites use HTTPS
A lock (
) or https:// means you've safely
connected to the .gov website. Share sensitive
information only on official, secure websites.
Skin conductance analysis of sleep peaks. The green arrows indicate regions with high-frequency peaks abutting transitions to REM. The yellow arrows indicate regions with high frequency peaks interrupted by wake.