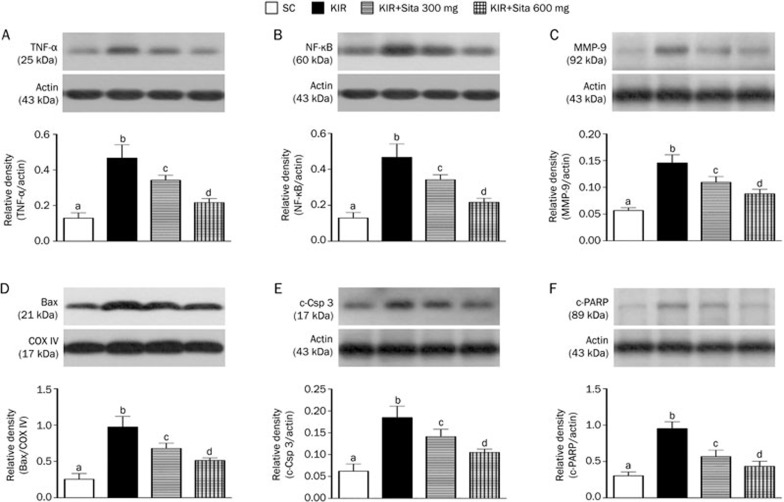
Figure 5.
Protein expressions of inflammatory and apoptotic biomarkers at 72 h after IR injury (n=8 for each group). (A) Analytical results of tumor necrosis factor TNF-α protein expression in kidney parenchyma at 72 h after IR procedure, cP<0.01 vs other groups. (B) Analytical results of nuclear factor NF-κB protein expression in kidney parenchyma at 72 h after IR procedure, cP<0.01 vs other groups. (C) Analytical results of matrix metalloproteinase (MMP)-9 protein expression in kidney parenchyma at 72 h after IR procedure, cP<0.01 vs other groups. (D) Analytical results of mitochondrial Bax protein expression in kidney parenchyma at 72 h after IR procedure, cP<0.01 vs other groups. (E) Analytical results of cleaved caspase 3 (c-CSP 3) protein expression in kidney parenchyma at 72 h after KIR procedure, cP<0.01 vs other groups. (F) Analytical results of cleaved PARP (c-PARP) protein expression in kidney parenchyma at 72 h after KIR procedure, cP<0.01 vs other groups. All statistical analyses using one-way ANOVA, followed by Bonferroni multiple comparison post hoc test. SC, sham control; KIR, kidney ischemia reperfusion; Sita, sitagliptin.

