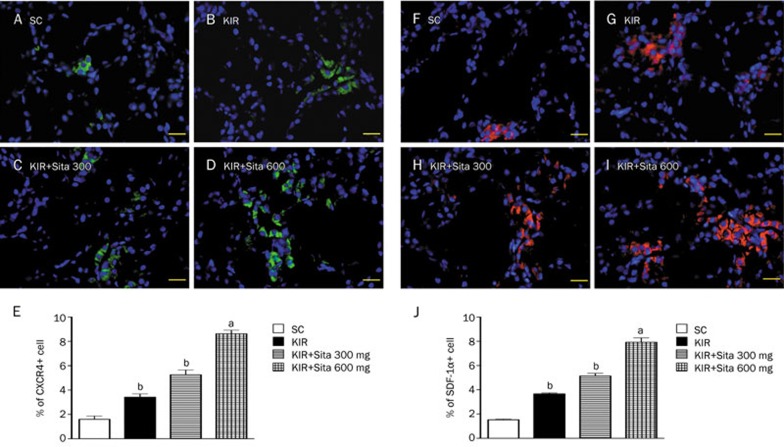
Figure 8.
Angiogenesis cellular expression at 72 h after IR injury (n=8 for each group). (A–D) IF microscopic findings (200×) showing the number of CXCR4+cells in kidney parenchyma among four groups at 72 h after IR procedure. (E) The analytical results of CXCR4+ cells in kidney parenchyma at 72 h after IR procedure: cP<0.01 vs sham control, bP=0.05 vs other groups. (F–I) IF microscopic findings (200×) showing the number of stromal cell-derived factor SDF-1α+ cells in kidney parenchyma among four groups at 72 h after IR procedure. (J) The analytical results of SDF-1α+ cells in kidney parenchyma at 72 h after IR procedure: cP<0.01 vs sham control, bP=0.05 vs other groups. Scale bars in right lower corner represent 50 μm. All statistical analyses were with one-way ANOVA followed by Bonferroni multiple comparison post hoc test. SC, sham control; KIR, kidney ischemia reperfusion; Sita, sitagliptin.

