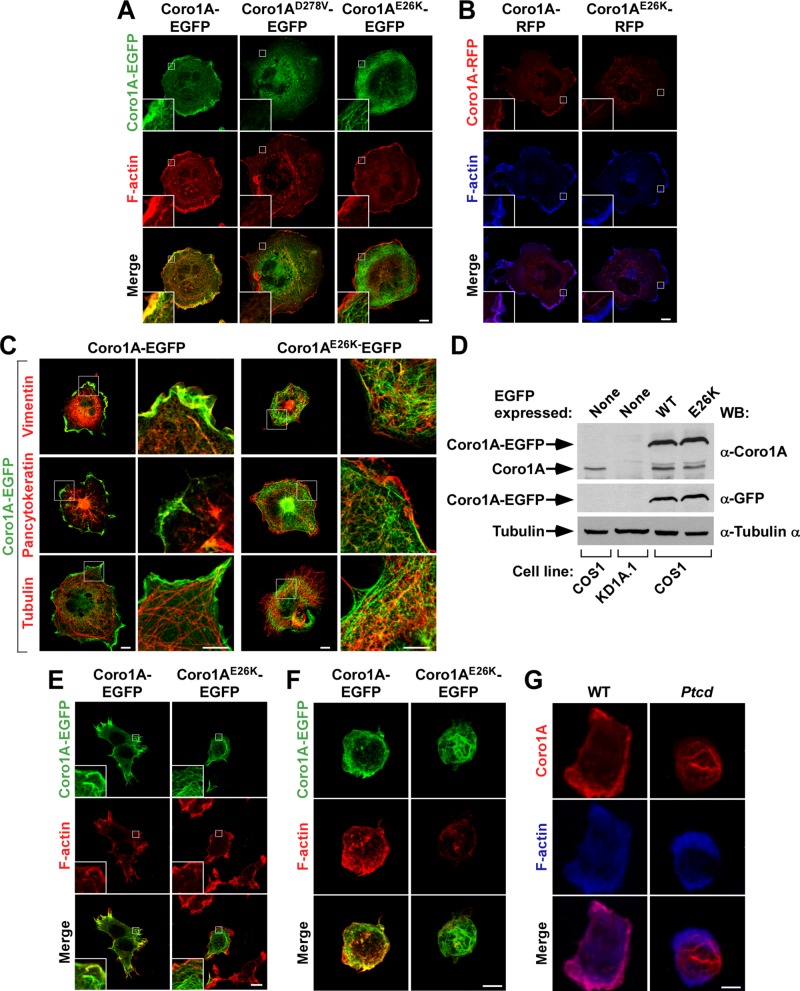
FIGURE 1:
Ectopic and endogenous Coro1AE26K decorate a phalloidin-negative filament meshwork. (A–C) Representative confocal images of COS1 cells expressing the indicated EGFP-tagged (A and C, green signals) and RFP-tagged (B, red signals) Coro1A versions (top) and stained with rhodamine-labeled phalloidin (A, red signals), Alexa Fluor 635–labeled phalloidin (B, blue signals), or antibodies to the indicated proteins (C, red signals). Potential colocalization areas between Coro1A proteins and F-actin had to be seen in either yellow (A, bottom) or purple (B, bottom). Potential colocalization areas between Coro1A proteins and vimentin, pancytokeratins, or α-tubulin had to be seen in yellow (C). Scale bars, 10 μm. Insets, enlarged images of the indicated cell areas (white open squares). (D) Total cellular lysates obtained from parental COS1 cells, CORO1A knockdown (KD1A.1) COS1 cells, and parental COS1 cells (bottom) transiently expressing EGFPs fused to either wild type (WT, top) or the Coro1AE26K (E26K, top) mutant were analyzed by Western blot (WB) analysis using the indicated antibodies (right) to detect the amount of endogenous (top) and ectopic Coro1A-EGFPs (top and middle) present in them. The amount of α-tubulin in each cell lysate was used as internal loading control (bottom). (E) Representative confocal images of HEK 293T cells expressing indicated EGFP-tagged Coro1A versions (top, green) and stained with rhodamine-labeled phalloidin (red). Potential colocalization areas between Coro1A proteins and F-actin had to be seen in yellow. Scale bars, 10 μm. Insets, enlarged images of the indicated cell areas (white open squares). (F) Confocal Z-stack three-dimensional (3D) reconstructions of Jurkat cells expressing the indicated ectopic Coro1A proteins (green signals) and stained with rhodamine-labeled phalloidin (red signals). Potential areas of colocalization between Coro1A and F-actin had to be seen in yellow (bottom). Scale bar, 5 μm. (G) Confocal Z-stack 3D reconstructions of thymocytes isolated from mice of indicated genotypes (top) and stained with antibodies to Coro1A (first and third rows, red signals) and Alexa Fluor 635–labeled phalloidin (middle and bottom, blue signals). Potential areas of colocalization between Coro1A and F-actin had to be seen in purple (bottom). Scale bar, 2.5 μm.

