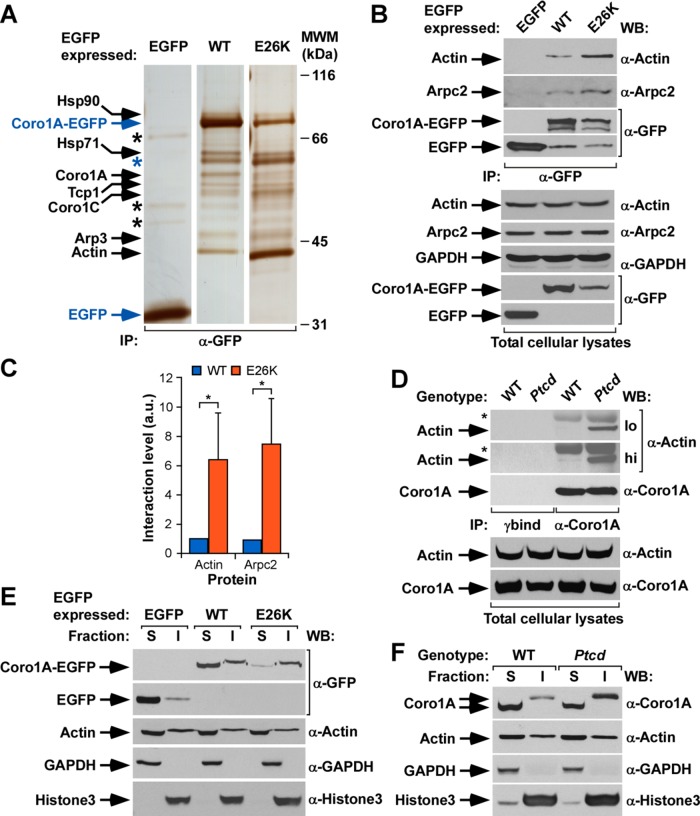
FIGURE 2:
The Coro1AE26K mutant has increased F-actin binding capabilities. (A) Silver-stained polyacrylamide electrophoresis gel showing the proteins that coimmunoprecipitate with indicated ectopic proteins (top) in COS1 cells. Proteins of interest are indicated on the left, with the bait proteins highlighted in blue. Only mass spectrometry hits with scores >56 were considered (see Materials and Methods). The Coro1A band likely corresponds to proteolytic fragments of the baits used. Black asterisks mark nonspecific bands detected in the control EGFP immunoprecipitation. The blue asterisk highlights a contaminant BSA band present in the coimmunoprecipitations made with the Coro1A baits (see text). Molecular weight markers (MWMs) are shown on the right. IP, immunoprecipitation. (B) EGFP immunoprecipitates (IPs) obtained from COS1 cells expressing the indicated ectopic proteins (top) were analyzed by Western blot to detect the amount of coimmunoprecipitated endogenous actin (top) and Arpc2 (second from top) in each experimental condition. As control, filters were immunoblotted with antibodies to EGFP (third and fourth from top) to visualize the amount of immunoprecipitated EGFP obtained in each sample. Amount of actin (fifth from top) and Arpc2 (sixth from top), GAPDH (seventh from top), and ectopic EGFPs (bottom two ) present in cell supernatants before the immunoprecipitation step was determined by Western blot analysis of aliquots of the total cell lysates used in the experiments. (C) Quantitation of the coimmunoprecipitation of indicated Coro1A proteins with endogenous actin and Arpc2 obtained in experiments shown in B. Values normalized according to the total amount of Coro1A-EGFP immunoprecipitated in each case. *p ≤ 0.05 (n = 3 independent experiments). a.u., arbitrary units. (D) Coro1A immunoprecipitates obtained from thymocytes isolated from WT or Ptcd mice were analyzed by Western blot to detect the amount of coimmunoprecipitated endogenous actin (top). As control, filters were immunoblotted with antibodies to Coro1A (third from top) to determine the amount of Coro1A immunoprecipitated in each sample. Amount of actin (fourth from top) and Coro1A (bottom) present in lysates before the immunoprecipitation step was determined by immunoblot analysis of aliquots of total cell lysates used in the immunoprecipitation step. hi, high exposure; lo, low exposure; *immunoglobulin heavy chain of the antibody used to immunoprecipiate Coro1A. γbind, immunoprecipitation done with beads in the absence of the antibody to Coro1A. (E) Distribution of indicated ectopic EGFPs (top) in Triton X-100–soluble (S) and –insoluble (I) fractions of transiently transfected COS1 cells. The distribution of Coro1A-EGFP and nonchimeric EGFP is shown in the first and second from the top, respectively. As control, we detected the distribution of endogenous proteins including actin (third from top), GAPDH (fourth from top), and histone H3 (bottom). (F) Distribution of endogenous Coro1A (WT) and Coro1AE26K (Ptcd) proteins present in thymocytes in the indicated Triton X-100–soluble (S) and –insoluble (I) fractions (top). Other markers used in this experiment are described in E. Similar results were obtained in two additional experiments. In B and D–F, antibodies used in the immunoblot analyses are indicated on the right of the appropriate Western blot strip.

