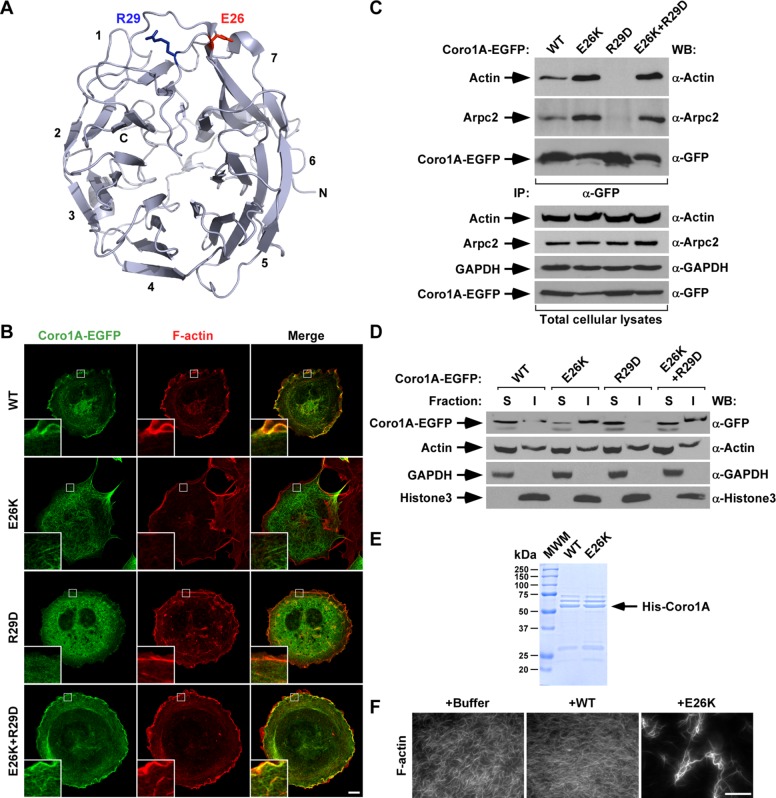
FIGURE 5:
The E26K mutation restores the association of both actin and Arpc2 to an actin binding–deficient Coro1A mutant. (A) Localization of the E26 and R29 residues (depicted as red and blue sticks, respectively) in the Coro1A β-propeller domain. Blades are numbered according to the standard nomenclature used for this type of domain. C, C-terminal end; N, N-terminal end. Illustration was generated using PyMol and the Coro1A crystal structure (Protein Data Bank: 2AQ5). (B) Representative confocal images of rhodamine-phalloidin–stained COS1 cells ectopically expressing indicated Coro1A-EGFPs (left). Coro1A proteins and F-actin are in green and red, respectively. Areas of colocalization are shown in yellow. Insets, enlarged images of the indicated cell areas (white open squares). Scale bar, 10 μm. (C) Anti-EGFP immunoprecipitates obtained from COS1 cells expressing the indicated Coro1A-EGFPs (top) were analyzed by Western blot to detect the amount of coimmunoprecipitated endogenous actin (top) and Arpc2 (second from top) in each experimental condition. As control, filters were immunoblotted with antibodies to EGFP (third from top) to visualize the amount of immunoprecipitated Coro1A-EGFP obtained in each sample. Amount of actin (fourth from top), Arpc2 (fifth from top), and Coro1A-EGFPs (bottom) present in lysates before the immunoprecipitation step was determined by immunoblot using aliquots of the same cell lysates used for the immunoprecipitation experiment. Antibodies used in each immunoblot analyses are indicated on the right. (D) Distribution of indicated Coro1A-EGFPs (top) and control endogenous proteins (remaining images) in Triton X-100–soluble (S) and –insoluble (I) fractions obtained from transiently transfected COS1 cells. Monitored proteins and antibodies used in immunoblots are shown on the left and right, respectively. Similar results were obtained in two independent experiments. (E) Coomassie-stained gel showing aliquots of His-tagged Coro1 proteins (arrow) purified from E. coli that were used in experiments presented in F. (F) Representative images of in vitro polymerized and phalloidin-stained F-actin upon incubation under the indicated experimental conditions for 15 min. Scale bar, 30 μm.

