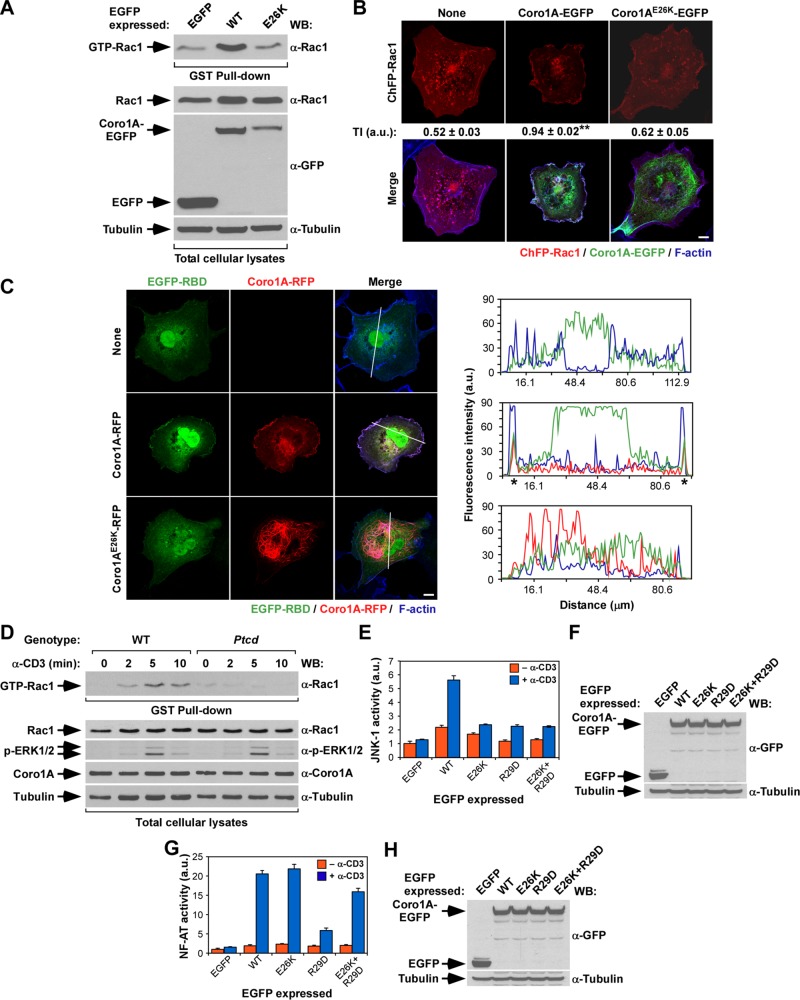
FIGURE 6:
The E26K mutation impairs the Coro1A-mediated activation of Rac1. (A) Top, activation levels of endogenous Rac1 upon expression in COS1 cells of indicated EGFPs. Bottom, aliquots of total cell lysates used in the foregoing experiment were immunoblotted to monitor the amount of total Rac1 (second from top) and EGFPs (third from top) present in the lysates used in the pull-down experiments. α-Tubulin was used as loading control (bottom; n = 3). Note that the E26K mutant shows lower abundance here due to its preferential localization in the nonsoluble fraction (see Figure 2). (B) Amount of cytosolic–plasma membrane translocation of ChFP-Rac1 in the presence of the indicated Coro1A-EGFPs (top). On transfection of appropriate plasmids, cells were fixed, stained with Alexa Fluor 635–labeled phalloidin, and subjected to confocal microscopy to visualize ChFP-Rac1 (top and bottom, red signals), Coro1A-EGFP proteins (bottom, green signals), and F-actin (bottom, blue signals). Areas of colocalization between Rac1, Coro1A, and F-actin are shown in white (bottom). Scale bar, 10 μm. The Rac1 translocation index (TI) is indicated below the first row of panels (see Materials and Methods for determination of this index). **p ≤ 0.01 compared with control cells (n = 3). (C) Left, levels of translocation of EGFP fused to the Rac1-binding domain of Pak1 (EGFP-RBD) from the cytosol to the plasma membrane in the presence of indicated Coro1A-RFP proteins (left). On transfection, cells were fixed, stained with fluorochrome-labeled phalloidin, and subjected to confocal analysis to visualize the EGFP-RBD bioreporter (left, green signals), Coro1A-RFP (middle, red signals) and F-actin (right, blue signals). Areas of colocalization of the three proteins are shown in white (right). The white lanes present on cells (right) highlight the cell sections selected in each case to measure the distribution of fluorescence intensities for EGFP-RBD (green lines), Coro1A-RFP (red lines), and F-actin (blue lines) in the graphs on the right. (D) Top, GST-RBD pull down showing the amount of GTP-Rac1 present in wild-type and Ptcd thymocytes under the indicated stimulation conditions (top). Bottom, aliquots of the same cell lysates were analyzed by Western blot to detect the abundance and/or phosphorylation levels of proteins indicated on the left (bottom four). The antibodies used in the immunoblot analysis are indicated on the right. (E–H) Activation of JNK (E) and NF-AT (G) induced by the indicated ectopically expressed proteins in nonstimulated (–α-CD3) and CD3-stimulated (+α-CD3) Jurkat cells. Data represent mean and SD of a representative experiment performed in triplicate. The abundance of ectopic proteins (F and H, top) and α-tubulin (loading control; F and H, bottom) in the JNK (F) and NF-AT (H) experiments is shown. Same results were obtained in a second independent experiment, also performed in triplicate.

