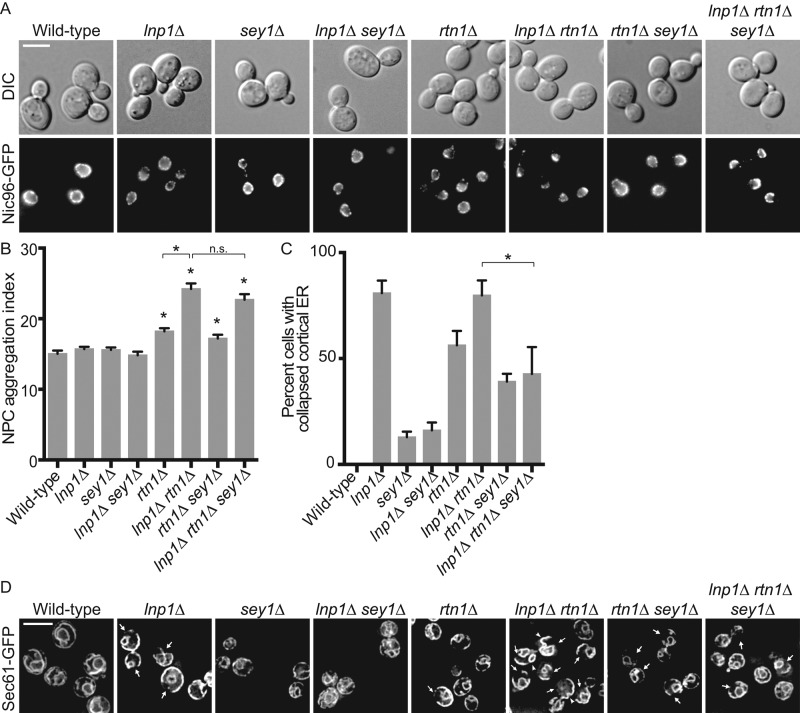
FIGURE 1:
lnp1Δ rtn1Δ cells have defects in NPC organization. (A) Parental or mutant cells expressing Nic96-GFP were grown to early log phase at 25°C and visualized by fluorescence microscopy. Scale bar, 5 μm. (B) The aggregation indexes of Nic96-GFP–expressing cells. Error bars represent SE. Asterisk denotes statistical significance (p < 0.01). n.s., no statistical significance. (C) Percentages of cells with regions of collapsed cortical ER as indicated by lack of peripheral Sec61-GFP staining as quantified from images of Sec61-GFP–expressing cells. Error bars represent SE. Asterisk denotes statistical significance (p < 0.01). (D) Parental or mutant cells expressing Sec61-GFP grown to early log phase at 25°C and visualized by fluorescence microscopy. Scale bar, 5 μm. Arrows mark typical regions of collapsed cortical ER in represented cells. Arrowheads for lnp1Δ rtn1Δ highlight aberrant folds in cortical ER.

