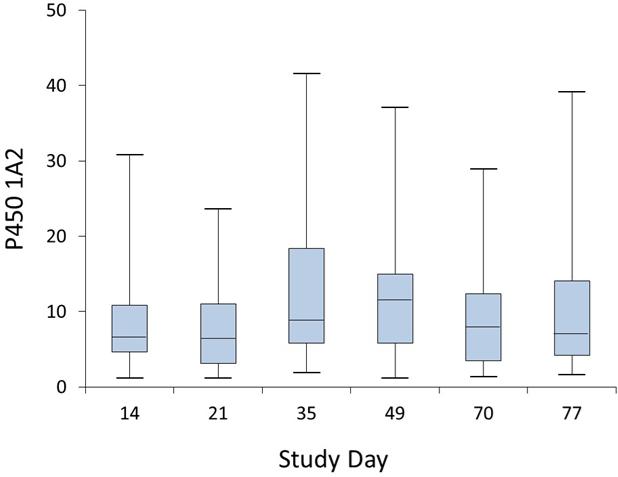
Figure 4.
Box and whisker plots showing the distributions of the caffeine P450 1A2 phenotype data measured over the 77 day feeding study. The length of the boxes represents the 25th to 75th percentiles, and the horizontal lines within the box represent the median values. The whiskers show the minimum and maximum values. Subjects refrained from eating well-done cooked meats from days 1 – 21 (pre-feeding phase) and following day 49 (post-meat feeding phase).

