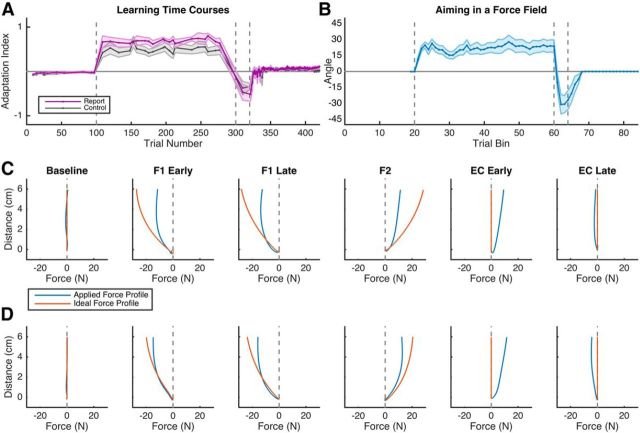
Figure 2.
Experiment 1 behavioral results. A, Adaptation index for the error clamp trials. Note that participants rapidly flip the sign of their applied force during F2 and show rebound of forces appropriate for F1 during the EC epochs. B, Participants in the Report condition report aiming directions that are appropriate to the applied forces in both the F1 and F2 epochs and quickly decay to 0° of aiming in the EC epoch. C, D, Averaged participant force profiles (blue) and ideal force profiles (red) for both the Control (C) and Report (D) conditions during selected error-clamp trials throughout the blocks of the task. The ideal force profile for a trial was computed by taking the participant's reach velocity at each time point and calculating the ideal force needed to counter perfectly the perturbation given that velocity. Shading represents SEM.

