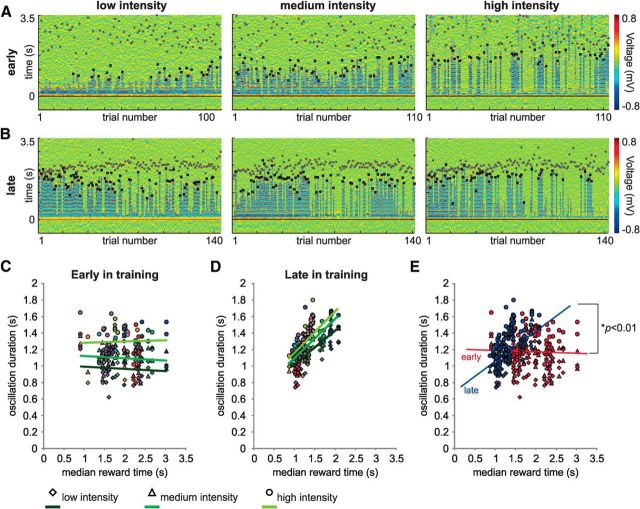
Figure 6.
With training, the visually evoked oscillations evolve to accord with the time to expected reward regardless of the intensity of the visual stimuli. A, Example of a session recorded early in training. Trials were plotted separately according to the intensity of the visual stimulus (low, medium, and high) in chronological order. Filled gray circles on color plots represent the nth lick. Black squares represent when the oscillation terminates. Early in training, the duration of the oscillation relates to the intensity of the visual stimuli: being shorter for low intensities and longer for higher intensities. B, Visually evoked activity for the same channel recorded after 3 weeks of training in the behavioral task. With training, the oscillation duration comes to accord well with the median reward time. C, D, Correlation between oscillation duration and median reward time early (C) and late (D) in training for all animals. The oscillation duration for each visual stimulus was plotted against the median reward time for that session. Each color represents a different hemisphere. C, Early in training, there is no correlation between the oscillation duration and the median reward time for any of the stimuli, although stimuli of greater intensity result in longer durations. D, However, when animals become experienced in the task, there is a positive and significant correlation between the oscillation duration and the expected reward time, yet they lose their relationship to stimulus intensity. E, The correlations early and late in training are significantly different (p < 0.0001, ANCOVA).

