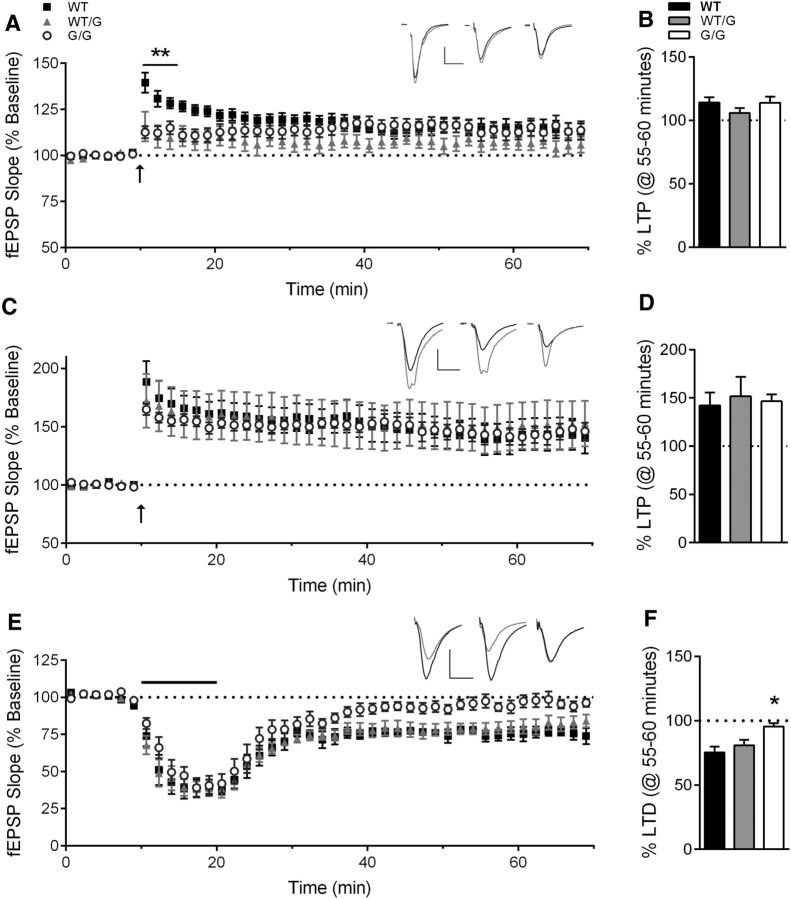
Figure 5.
Hippocampal synaptic plasticity is impaired in Shank3G/G mice. A, LTP induced by a single 1 s, 100 Hz train (arrow) is normal at 55–60 min after tetanus, summarized in B, although PTP in the first 5 min following conditioning stimulus is decreased in Shank3WT/G and Shank3G/G mice (WT, n = 13 slices/8 mice; Shank3WT/G, n = 9 slices/5 mice; Shank3G/G, n = 9 slices/5 mice). Inset, Average of 10 consecutive raw traces immediately preceding (black) and 60 min (gray) after conditioning stimulus for WT (left), Shank3WT/G (middle), and Shank3G/G (right). Calibration: 0.25 mV, 10 ms. C, LTP induced by four, 1 s, 100 Hz trains (arrow) is not affected by the Shank3G mutation, as summarized at 55–60 min after induction (D) (WT, n = 7 slices/5 mice; Shank3WT/G, n = 10 slices/5 mice; Shank3G/G, n = 8 slices/4 mice). Inset, Average of 10 consecutive raw traces immediately preceding (black) and 60 min (gray) after conditioning stimulus for WT (left), Shank3WT/G (middle), and Shank3G/G (right). Calibration: 0.25 mV, 10 ms. E, mGluR-LTD induced by 10 min application of 100 μm DHPG (bar) is impaired at 55–60 min following DHPG washout (F) in Shank3G/G mice (WT, n = 7 slices/5 mice; Shank3WT/G, n = 13 slices/5 mice; Shank3G/G, n = 8 slices/6 mice). Inset, Average of 10 consecutive raw traces immediately preceding (black) and 60 min (gray) after DHPG application for WT (left), Shank3WT/G (middle), and Shank3G/G (right). Calibration: 0.5 mV, 10 ms. For clarity, scatter plots are represented as the mean ± SEM of 5 consecutive data points. *p < 0.05. **p < 0.01.

