
Figure 4.
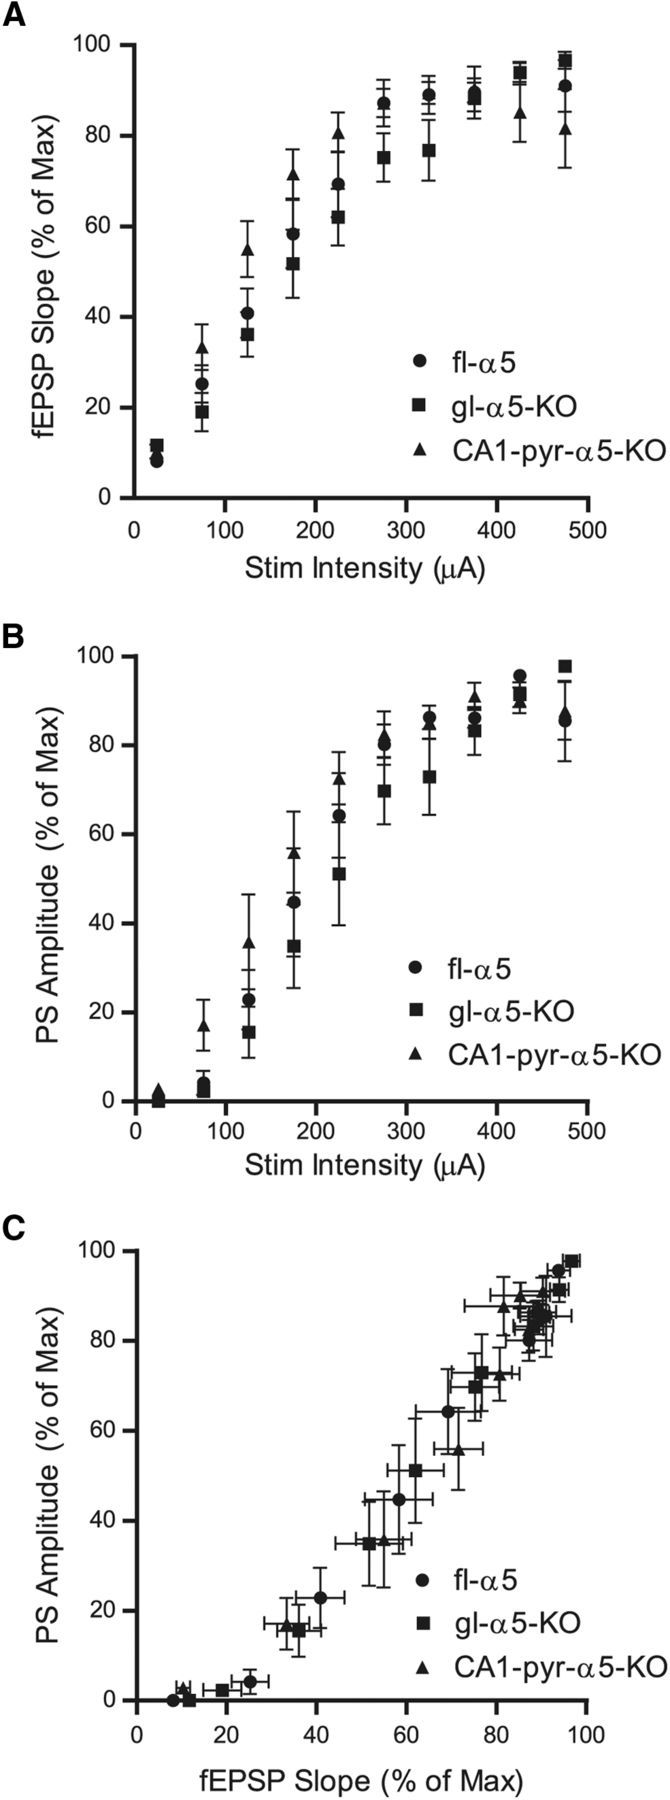
Characterization of baseline responses in fl–α5 and KO mice. A, B, Input–output relationships for fEPSP slope (A) and PS amplitude (B), obtained over a range of stimulus intensities in brain slices prepared from fl–α5 (n = 7), gl–α5–KO (n = 6), and CA1–pyr–α5–KO (n = 8) mice. The slopes of fEPSPs recorded in the stratum radiatum and amplitudes of PSs recorded near the stratum pyramidale were normalized to the maximum values attained for each brain slice. The stimulus intensities applied to each brain slice varied; therefore, values were sorted and averaged in 50 μA bins. C, Input–output relationship between fEPSP slope and PS amplitude for each mouse strain. Data are shown as mean ± SEM.