
Figure 1.
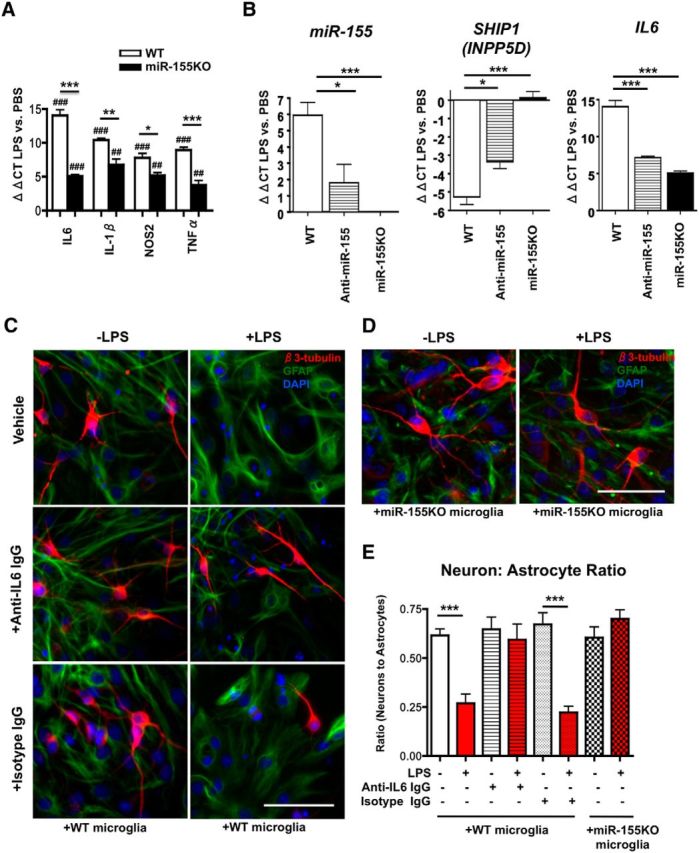
miR-155 is critical for robust LPS-induced IL6 gene induction. A, B, Microglial miR and mRNA expression after LPS stimulation in vitro. Acutely isolated neonatal murine microglia from WT or miR-155−/− (miR-155KO) mice were plated and stimulated with PBS or LPS (20 ng/ml) for 4 h. Total RNA including miRs was extracted and subjected to RT-PCR for IL6, IL-1β, NOS2, and TNFα (A) or miR-155 (left), SHIP1 (middle), and IL6 (right) (B). Graphs show ΔΔCT value of LPS-treated microglia versus PBS-treated microglia. ***p < 0.001, **p < 0.01, and *p < 0.05 versus WT group; ###p < 0.001, ##p < 0.01, and #p < 0.05 versus PBS-treated group as determined by 1-way ANOVA and Tukey post hoc. Data are shown as mean ± SEM. C, IL6 contributes to LPS-induced decrease in neural differentiation in vitro. Top, 4 h LPS stimulation (20 ng/ml) of microglia leads to significant reduction in βIII-Tubulin+ neuron (red) to GFAP+ astrocyte (green) ratio in cocultured NSCs (NSCs; pictured in C and D), corrected by treatment with anti-IL6 antibody (middle) but not isotype control antibody (bottom). D, miR-155 knock-out in microglia rescues LPS-induced decrease in neuron: astrocyte ratio of cocultured NSCs (pictured). For C and D, 20× objective original magnification; scale bars, 100 μm; nuclei shown in blue (DAPI). E, Quantification of neuron: astrocyte ratio as described in C and D. White bars, NSCs cocultured with PBS-treated microglia; red bars, NSCs cocultured with LPS-treated microglia. n = 3–4 wells per group. ***p < 0.001 as determined by 1-way ANOVA and Tukey post hoc. Data are shown as mean ± SEM.