
Figure 8.
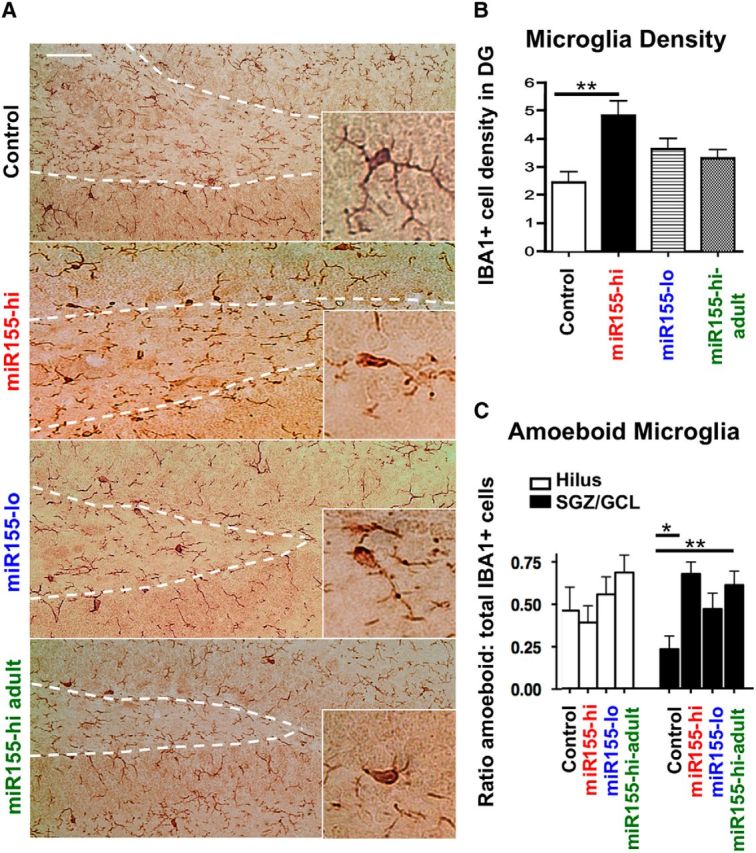
Elevated miR-155 increases microglia density in the DG and amoeboid morphology in the SGZ and GCL, but not in the hilus. A, Representative images of miR-155-induced changes in IBA1+ microglia morphology in the DG. Scale bar, 100 μm. Original magnification = 20×. Inset shows high-magnification representative IBA1+ cells. B, Density of IBA1+ cells in the DG, including SGZ, GCL, and hilus (see Fig. 2A diagram). C, Proportion of amoeboid versus total IBA1+ microglia in the hilus (white bars) and the SGZ/GCL regions (black bars) as quantified according to the microglia morphology. Morphology characterization criteria was modified from Lawson et al. (1990). n = 10–20 images counted from at least 2 animals per group. *p < 0.05 as determined by 1-way ANOVA and Tukey post hoc. Data are shown as mean ± SEM.