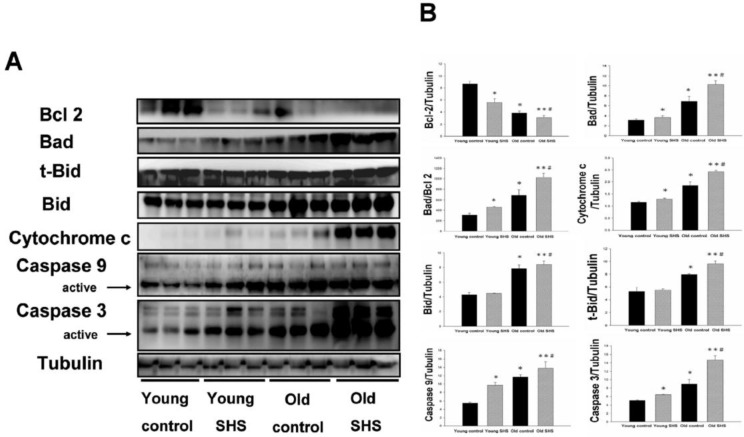
Figure 3.
Mitochondrial apoptosis protein expression augmented in old rat hearts exposure to SHS. (A) Representative western blotting analysis of protein expression levels for Bcl 2, Bad, t-Bid, Bid, Cytochrome c, Caspase 9 and Caspase 3 in young control, young SHS exposure, old control and old SHS exposure rats heart. (B) Quantitative analysis of protein densitometry expression levels for Bcl 2, Bad, t-Bid, Bid, Cytochrome c, Caspase 9 and Caspase 3. Results are as the optical density ratio of Bad to Bcl 2, α-Tubulin protein levels showed protein loading. Bars show means ± SEM (N=6). *p<0.05, **p<0.01 significant statistic difference compared with young control. #p<0.05, significant statistic difference compared with old control.

