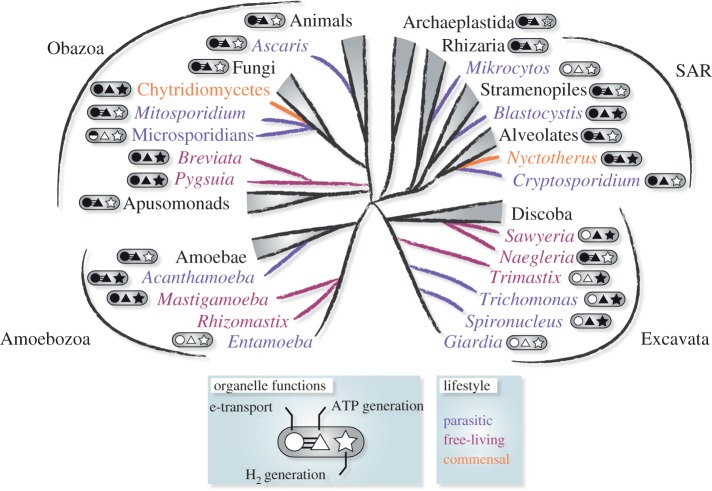
Figure 1.
Distribution of MROs across the major supergroups of eukaryotes. Organisms with parasitic (purple), commensal (orange) or free-living (red) lifestyles are indicated. Metabolic functions of each organism's MRO are indicated: shaded shapes represent the presence of electron transporting complexes (circle), ATP synthesis (triangle) and hydrogen production (star). Where at least one proton-pumping complex (CI, CIII, CIV) and ATP synthase (CV) was identified, the circle and triangle are joined by three lines. ‘*’ represents algal lineages where hydrogen production is located in the plastid.

