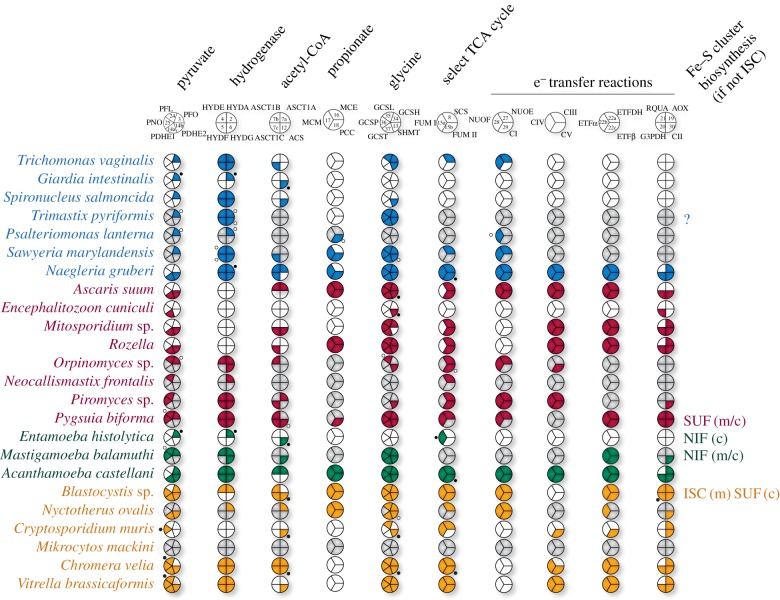
Figure 3.
Coulson plots showing the presence and absence of various proteins and/or protein subunits in anaerobic protists. Blue, Excavata; red, Obazoa; green, Amoebozoa; yellow, SAR clade (Stramenopiles, Alveolata and Rhizaria). Coloured sections indicate proteins found to be present in genome or transcriptome data; white sections, proteins absent from complete genome data; grey sections, proteins absent from transcriptome or incomplete genome data [19]. Black and white circles indicate proteins with a predicted cytosolic location based on Mitoprot predictions or incomplete coding sequences. Unless indicated otherwise, all lineages use the ISC system for the biosynthesis of Fe–S clusters. Enzyme abbreviations are as indicated in figures 2. Accession numbers for each protein can be found in the electronic supplementary material, S1.

