Figure 4.
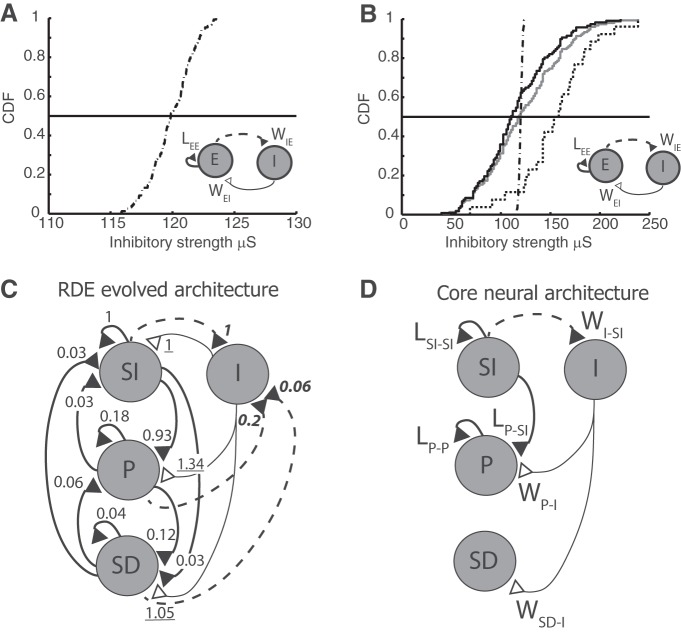
Evolved and core network architectures. A, B, Cumulative distribution function (CDF) of inhibitory projection strengths used in simulations. Insets, Network architecture. A, CDF used in Figure 2. B, CDF used in Figure 3, where the gray trace represents the distribution of all inhibitory projections and the black solid and black dotted traces represent the inhibitory projections that specifically synapse onto SI and P neuronal populations, respectively. The distribution in the latter case is shifted toward higher values with a mean that is ∼30% larger than that of the gray trace. For comparison, the trace shown in A is also plotted in B (dot-dashed); note, however, the change in scale. C, Evolved network architecture after training using the RDE rule, which results in the emergent subpopulations: SI, P, and SD. Numbers indicate relative strength of connection: LEE connections are normalized to the SI-to-SI strength, WEI connections to the I-to-SI strength (underlined numbers), and WIE connections to the SI-to-I strength (bold italic numbers). D, Core neural network architecture that retains the strongest connections between subpopulations.

