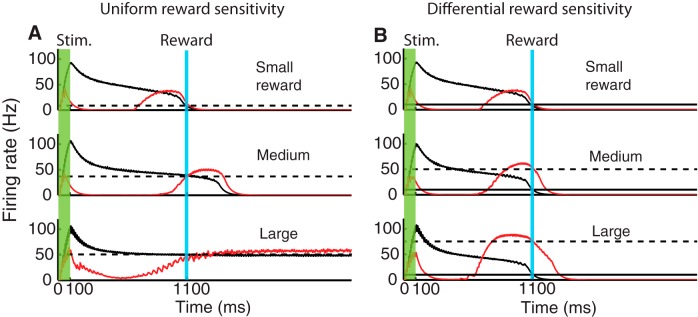
Figure 8.

Encoding and reporting expected reward magnitude by differential reward sensitivity of SI and P populations. All traces correspond to population firing rates obtained from the network architecture shown in Figure 7 (inset). Black represents response of SI population. Red represents response of P population. The activity of the inhibitory population has been omitted for clarity. A, The sensitivity to the magnitude of the reward is uniform for neurons in the SI and P populations. As the magnitude of the reward is increased from an equivalent target firing rate of 10 Hz (small reward) to 40 Hz (medium reward) and to 50 Hz (large reward), the SI response becomes bistable and cannot follow these changes. B, If there is a differential reward sensitivity, with SI neurons responding to a fixed equivalent target rate of 10 Hz, and P neurons to increases in reward magnitude, from 10 Hz (small reward) to 50 Hz (medium reward) and 70 Hz (large reward), then these neurons are capable of encoding differences in expected reward magnitude. In this case, the magnitude of the firing rate for the P population can surpass the limit of 50 Hz observed in A (black dashed line).
