
Figure 9.
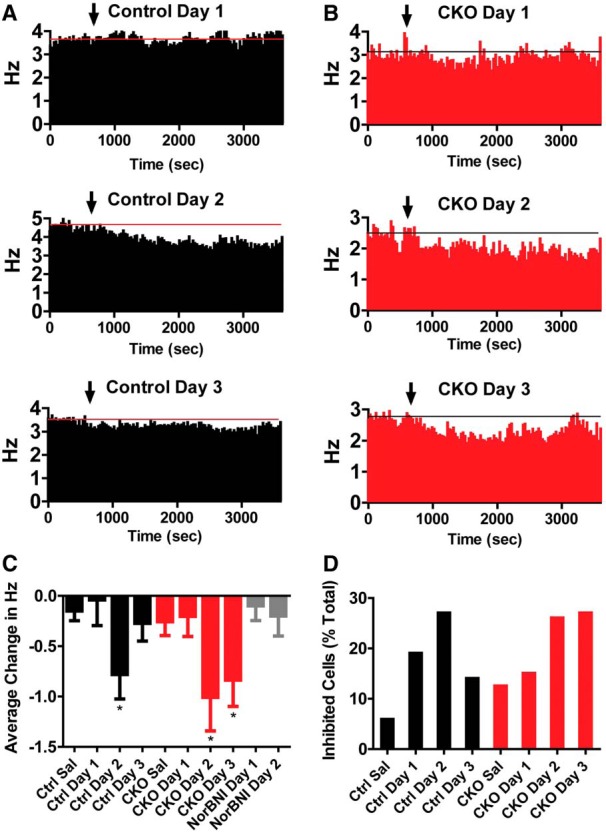
A, B, Change in firing rate following injection of saline or U50 on consecutive days for control (A) and CKO (B) mice (control saline, N = 31; U50 d 1, N = 21; U50 d 2, N = 26; U50 d 3, N = 35; p38αCKODAT saline, N = 33; U50 d 1, N = 40; U50 d 2, N = 35; U50 d 3, N = 41). Data are presented as the average change in firing rate (Hz) from a 10 min baseline period. Data are binned into 10 min blocks. C, Average change in firing rate during the last 40 min following injection of saline or U50,488 across groups. *p < 0.05, relative to corresponding saline (Bonferroni post-test). D, Change in firing rate following injection of U50 on successive days. Mice were pretreated with an injection of norBNI 50 min before U50 on day 1 (U50 d 1, N = 22; U50 d 2, N = 24).