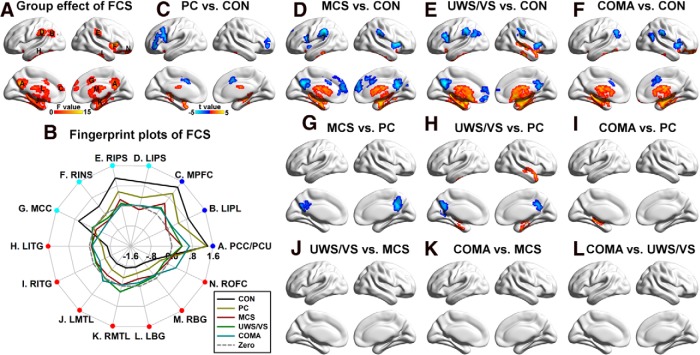
Figure 2.
Group differences in FCS. A, Main group effect of FCS among the five groups (p < 0.05 corrected, with uncorrected p < 0.01 for each voxel and a minimum of 84 voxels in each cluster). The largest region was composed of multiple brain areas and was decomposed into several subregions, including the right anterior insula, left inferior temporal gyrus, right inferior temporal gyrus, left medial temporal lobe, right medial temporal lobe, left basal ganglia, right basal ganglia, and right orbital frontal cortex. B, Fingerprint plots of the mean fitted FCS (FCS with covariates such as the age and gender removed) across the five groups for each of the regions that showed main group effects. Regions overlapping the DMN are labeled in blue, while those overlapped with the SN/ECN were labeled in cyan. Other regions that showed increased FCS with decreased consciousness were labeled in red. C–L, Post hoc comparisons of 10 pairs of groups (p < 0.05 corrected). Two-sample t-maps highlighting the difference between PC patients and CONs (C), MCS patients and CONs (D), UWS/VS patients and CONs (E), coma patients and CONs (F), MCS and PC patients (G), UWS/VS and PC patients (H), coma and PC patients (I), UWS/VS and MCS patients (J), coma and MCS patients (K), and coma and UWS/VS patients (L) are shown. To note, there was no significant difference between UWS/VS and MCS patients (J), between coma and MCS patients (K), or between coma and UWS/VS patients (L). LIPL, Left inferior parietal lobule; MPFC, medial prefrontal cortex, LIPS, left intraparietal sulcus; RIPS, right intraparietal sulcus; RINS, right anterior insula; MCC, middle cingulate cortex; LITG, left inferior temporal gyrus; RITG, right inferior temporal gyrus; LMTL, left medial temporal lobe; RMTL, right medial temporal lobe; LBG, left basal ganglia; RBG, right basal ganglia; and ROFC, right orbital frontal cortex.

