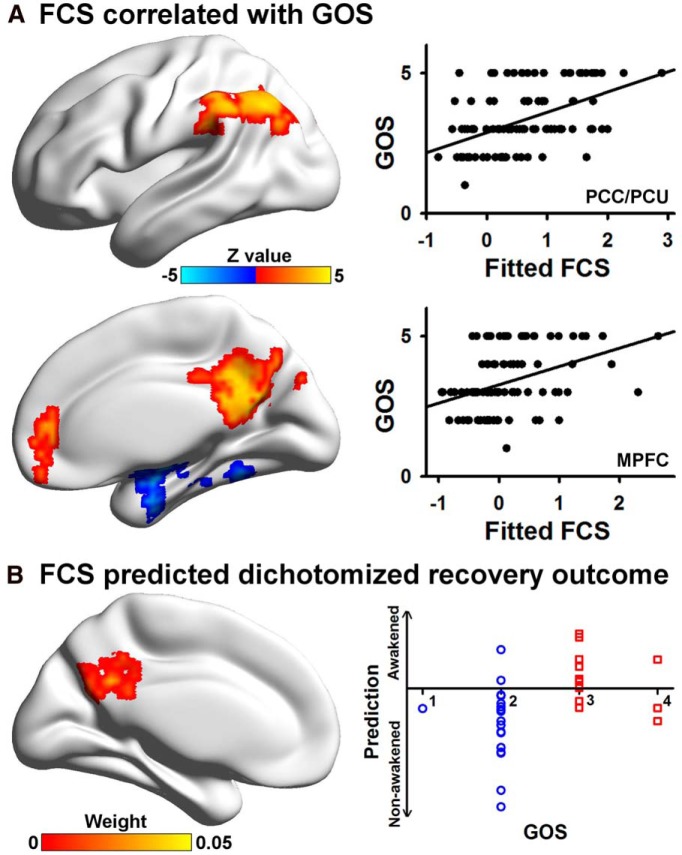
Figure 4.
FCS predicted recovery outcome. A, Five regions showed significant correlations with the GOS score (p < 0.05 corrected). Scatter plots showing the difference between the mean fitted FCS in two representative regions (the PCC/PCU and the MPFC) and the GOS score are shown. B, Absolute discriminating maps of multivariate support vector machine analysis of UWS/VS plus coma patients to characterize awakened or nonawakened status 3 months after the fMRI scanning using FCS (clusters with at least 84 voxels were shown). The classifier with the LOOCV demonstrated accuracy of 81.25%, a specificity of 88.89%, and a sensitivity of 71.43%. Scatter plot shows that 2 of 18 nonawakened patients (GOS score <3, labeled in blue circle) were incorrectly classified, and 4 of 14 awakened patients (GOS score >2, labeled in red square) were incorrectly classified. MPFC, Medial prefrontal cortex.

