
Figure 8.
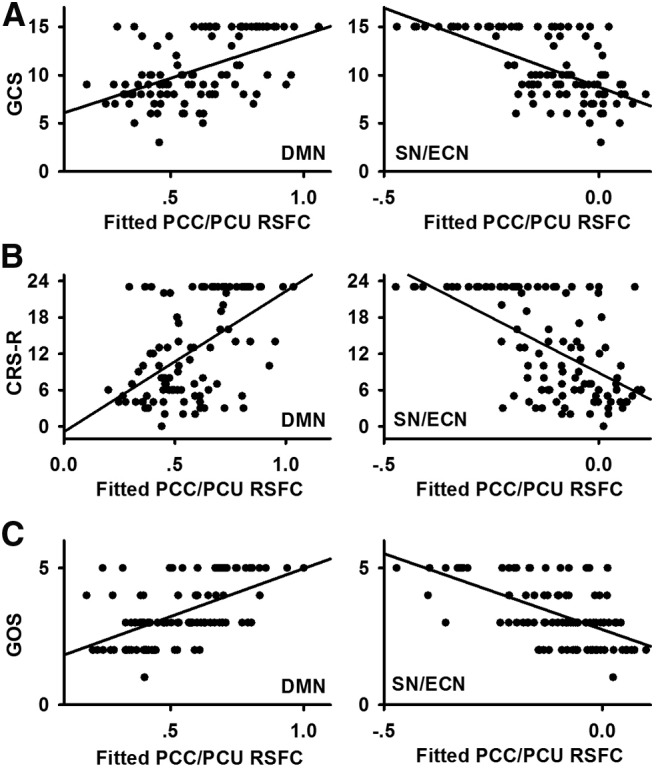
A–C, Scatter plots demonstrate the relationship between PCC/PCU resting-state functional connectivity (RSFC) and clinical indices, including GCS score (A), CRS-R score (B), and GOS score (C). Figure 7 demonstrates that the regions that negatively correlated with clinical indices are located in the SN/ECN, while those that positively correlated with clinical indices are in the DMN. Thus, for each clinical index, all the voxels that positively correlated with that clinical index are defined as DMN, while those that negatively correlated with that clinical index are defined as SN/ECN. Scatter plots between clinical indices and mean fitted PCC/PCU RSFC (with covariates such as age, gender, and time of fMRI after injury removed) of the DMN are shown in the left column. Similarly, scatter plots between clinical indices and the mean fitted PCC/PCU RSFC of the SN/ECN are shown in the right column.