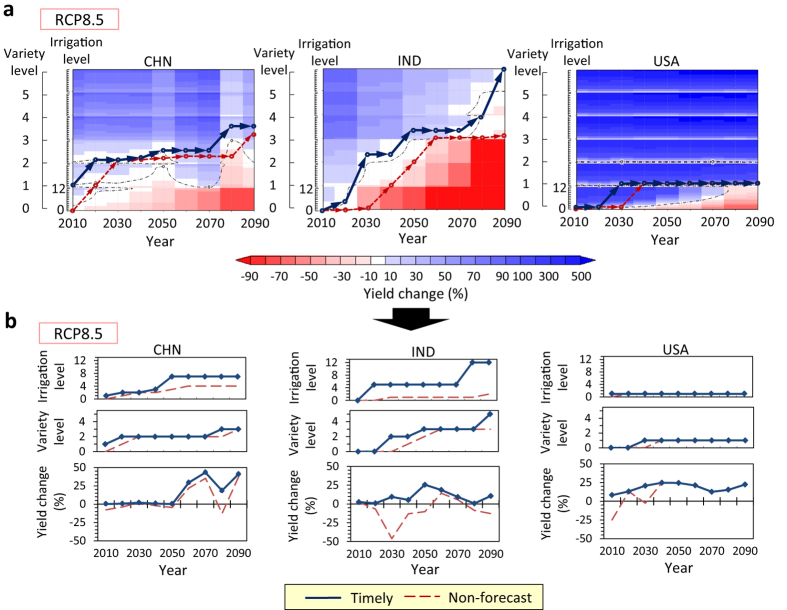
Figure 1. Adaptation pathways and yield change from the current level in the timely case and in the non-forecast case in China (CHN), India (IND), and the United States (USA) under the RCP8.5 scenario of the MIROC-ESM projection.
(a), Time evolution of yield change for all adaptation sets (13 irrigation × 6 variety) and adaptation pathways. The thin black broken lines represent 0% change. (b), Adaptation pathways and yield change extracted from (a).

