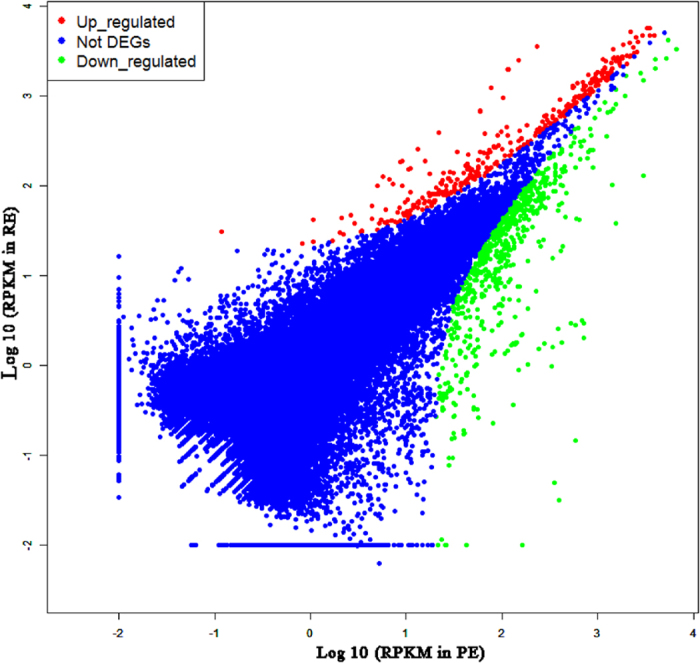
Figure 5. Volcano plots analyses of unigenes in PE and RE.

X-axis on both panels shows base 10 logarithm of RPKM of pre-receptive endometrium. Y axis shows receptive endometrium. Red dots indicate up-regulated genes, blue was not DEG, and the green was down-regulated genes in in the receptive endometrium compared to pre-receptive phase.
