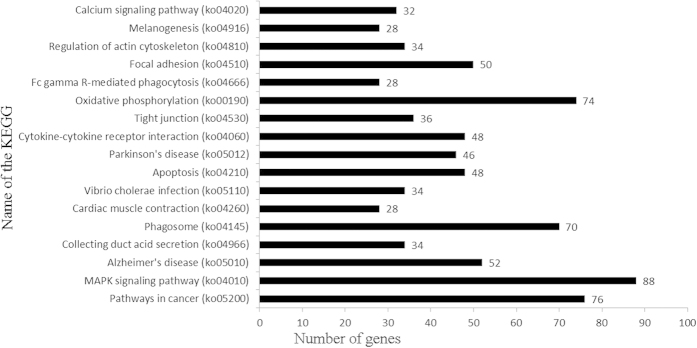
Figure 8. Histogram presentation of the top 17 KEGG functional annotations for the DEGs.

The x-axis indicates the number of unique sequences assigned to a specific pathway, the y-axis indicates the KEGG pathway.

The x-axis indicates the number of unique sequences assigned to a specific pathway, the y-axis indicates the KEGG pathway.