
Figure 1. Analysis of evolution genomics.
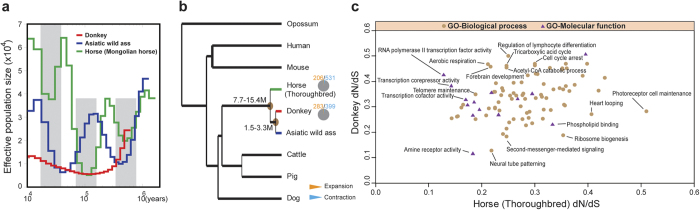
(a) Reconstructed population demographics of donkey, Asiatic wild ass and horse for the last 1 million years. (b) Phylogenetic tree of nine mammals. The numbers represent the time of divergence. The proportion of expanded and contracted gene families are shown as pie charts at branch termini. (c) Rapidly evolving functions of donkey and horse.