
Figure 2.
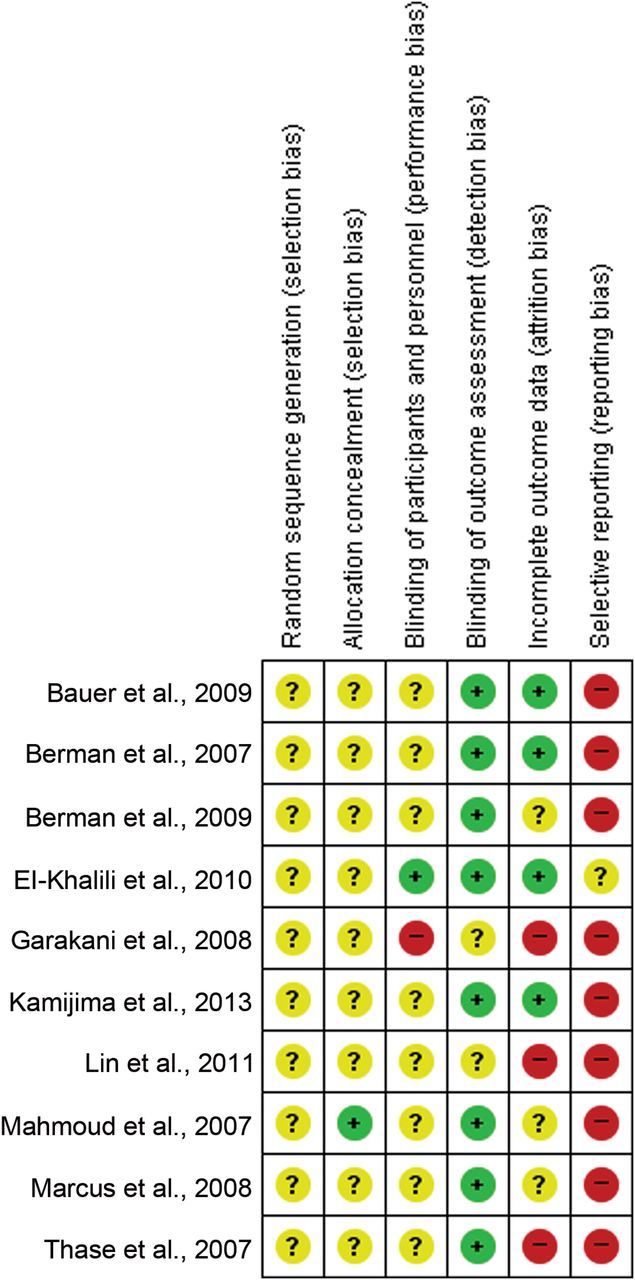
Risk of Bias Graph of Included Studies. The colors represent the quality of the studies included in this meta-analysis: red for high risk, yellow for uncertain, and green for low risk. The overall risk is unclear.
Official websites use .gov
A
.gov website belongs to an official
government organization in the United States.
Secure .gov websites use HTTPS
A lock (
) or https:// means you've safely
connected to the .gov website. Share sensitive
information only on official, secure websites.
Risk of Bias Graph of Included Studies. The colors represent the quality of the studies included in this meta-analysis: red for high risk, yellow for uncertain, and green for low risk. The overall risk is unclear.